November 8, 2026
Weekly Market Outlook
By Geoff Bysshe

“Analysts love the baseball analogy that, 'AI is only in the third inning.' After last week, the bulls might feel like the third inning ended with the heart of their lineup striking out.
AI may still be in the early innings of its development, but for investors, the game has changed.”
That quote didn't reference last week's market drop. It was written before last week's market collapse, in last week's Market Outlook, “Collapsing Stock Prices Should Not Surprise Investors. Wall Street Is Losing Faith in the Hyperscalers' Growth Story.”
Of course, it could also apply to Thursday's tech-wreck market action.
Each has its own pros and cons. Both require you to know what you're doing. Neither works well if you change your strategy at the wrong time.
For the last several months, and likely for the next several months, investors' conviction in each of these approaches will be severely tested.
Last week's market action demonstrated what happens when long-term investors suddenly start thinking like short-term traders, while leveraged traders discover that their positions can no longer withstand the volatility.
The result is a market where investors who intended to hold for years start selling because of what happened in a day, while others are forced to sell whether they want to or not.
Thursday was ugly.
Thursday's collapse did not come out of nowhere.
For months, the semiconductor sector had been displaying signs of deteriorating momentum, weakening relative performance, and increasingly narrow leadership.
One of the most revealing warnings came when Nvidia, AMD, and Taiwan Semiconductor reached new highs, but the semiconductor ETF (SMH) failed to follow.
When three of the largest companies in an ETF are making new highs and the ETF itself cannot, something is wrong beneath the surface.
At the same time, our Real Motion indicator was showing deteriorating momentum, even as prices attempted to maintain their bullish trends.
The warnings weren't limited to technical indicators.
As we discussed last week, investors had become increasingly willing to sell stocks following earnings announcements, even when the companies reported good results.
In a healthy bull market, strong earnings and guidance tend to attract buyers. When investors consistently use that good news as an opportunity to sell, it's a warning that the market's expectations for future growth may already be too high.
This was particularly evident among the hyperscalers and semiconductor companies that had been driving the AI trade.
Despite the obvious selling into good news, the AI trade remained heavily owned, and leverage was still substantial.
Then Wednesday's powerful post-election rally added another layer of optimism to an already crowded trade. Investors who bought the rally found themselves exposed to Thursday's sudden reversal.
The Technical Inflection Points
By Wednesday's close, SMH, SPY, and QQQ were sitting at important technical inflection points.
SMH had already suffered substantial technical damage, while the major indexes were approaching critical support levels, including their 200-day moving averages.
These are precisely the situations where relatively modest developments can trigger disproportionately large moves.
The market was vulnerable, but vulnerability alone doesn't tell us when a breakdown will occur.
For that, we need a catalyst.
At MarketGauge, we have a process for evaluating important news events, whether they're FOMC announcements, major economic reports, or elections.
We don't simply look at the initial reaction and assume it tells us how the market will respond over the coming days.
Instead, we focus on three stages:
This pattern maps out a normal emotional reaction cycle to an event.
Last week's election provided a textbook example of why the third stage is so important.
Following Tuesday's election, Wednesday's market action was overwhelmingly positive. Investors appeared enthusiastic about the results and the potential implications for the economy and financial markets.
One warning sign that this initial reaction might become a trap was that the semiconductor sector failed to participate meaningfully in the rally.
Even with the broader market rallying strongly, investors were still selling semiconductor stocks.
Then came Thursday.
Political optimism that had fueled Wednesday's rally was challenged by renewed uncertainty over the election's implications, including concerns about potential restrictions on data-center development.
Catalyst #2: Qualcomm Exposes Rising Costs Across the Semiconductor Industry
On Wednesday evening, Qualcomm reported earnings that exceeded analysts' headline revenue and earnings expectations.
However, the details disappointed investors.
The company reported a substantial decline in handset revenue and warned of rising costs throughout the semiconductor supply chain.
Importantly, these weren't simply company-specific expenses.
Qualcomm identified broad-based cost increases affecting wafer fabrication, memory, advanced packaging, assembly, testing, and other semiconductor inputs.
Those pressures have implications beyond Qualcomm.
These cost pressures threaten profit margins for companies unable to pass them on to customers. They also raise questions about the ultimate cost and pace of the AI infrastructure buildout.
The numbers were concerning enough to cause at least 10 brokerages to subsequently lower their price targets for Qualcomm.
The company wasn't telling investors that AI growth was over. In fact, it maintained ambitious expectations for its data-center business.
But the report provided evidence that the cost of supporting that growth was becoming increasingly challenging.
And it arrived at exactly the wrong time.
Semiconductor momentum was already deteriorating. Investors were increasingly selling into good earnings news. The election reaction was losing its enthusiasm.
Qualcomm's report and the renewed political concerns helped push an already vulnerable market over the edge.
Thursday's collapse wasn't simply a normal reaction to disappointing earnings or political uncertainty.
The combination of deteriorating momentum, overcrowded positioning, and new fundamental concerns created the conditions for a violent liquidation.
The Philadelphia Semiconductor Index fell approximately 12%, with major companies across the industry suffering extraordinary declines.
But the selling didn't stop with semiconductors.
It spread throughout technology and eventually engulfed much of the broader market.
Evidence reported after Thursday's close suggests that mechanical and forced selling helped amplify the decline.
Nomura estimated that leveraged ETFs faced approximately $47 billion in required stock sales to rebalance their exposure. JPMorgan also identified selling pressure from systematic strategies responding to deteriorating market conditions.
That $47 billion was an estimated rebalancing requirement, not a confirmed execution total. Nomura's estimate ranked among the largest such events in its historical data. Leveraged funds must adjust exposure as prices change, creating additional selling pressure precisely when markets are already declining.
This can create a feedback loop: falling prices force selling, which pushes prices lower and triggers still more selling.
These investors weren't necessarily making new judgments about the long-term prospects for AI.
Some were selling because their trading rules, leverage constraints, or risk-management requirements demanded it.
When a stock falls because investors no longer believe in its future, the fundamental outlook has changed.
When a stock falls because investors are forced to liquidate positions, the resulting decline can be considerably larger than the change in fundamentals would otherwise justify.
Thursday appeared to contain both types of selling.
The question now is whether the liquidation was sufficient to exhaust the sellers or whether the breakdown has further to go.
A 12% decline in the semiconductor index is an extraordinary day.
But an extraordinary day doesn't necessarily mean the longer-term market environment has become extraordinary.
Since the financial crisis, the semiconductor industry has experienced an enormous secular bull market, interrupted by several major corrections.
How Much Further Could SMH Fall?
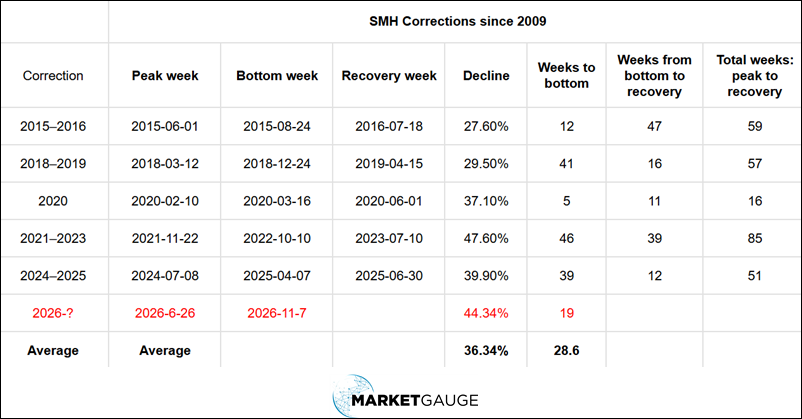
Our historical analysis shows that major SMH corrections have averaged approximately 36%.
Two have lasted 40% or more.
This correction feels catastrophic in the moment, but it is still relatively normal within a powerful long-term bull market.
The 200-week moving average has frequently provided important support during major semiconductor corrections.
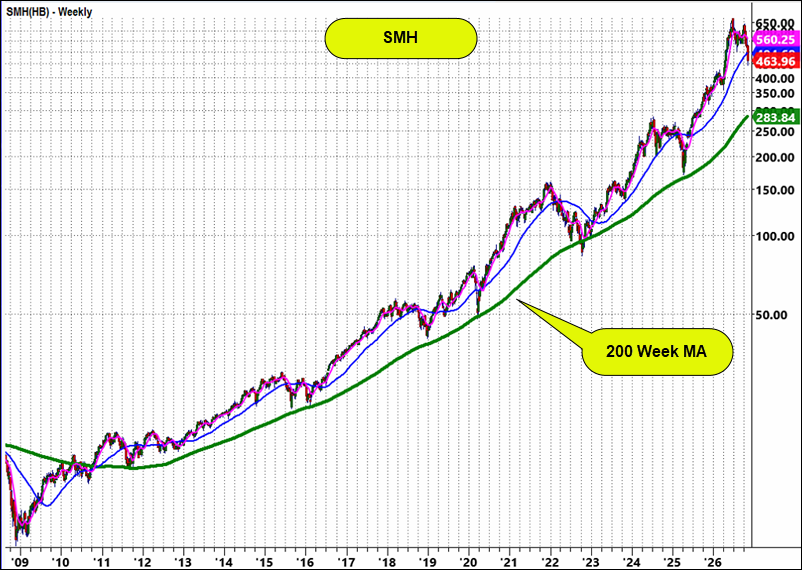
More immediately, the area surrounding 400 on SMH, roughly 380 to 420, represents a potential support zone if the current decline continues.
That doesn't mean SMH must fall to 400. Thursday's decline could have marked a significant washout.
However, given the deterioration in momentum and the evidence of selling into strength over recent months, I would prefer to see convincing evidence of a bottom before assuming the worst is over.
Most importantly, even a further significant decline in SMH would not necessarily mean the AI revolution, or the secular semiconductor bull market, is over.
What About the Bullish Post-Midterm Election Statistics?
Another popular argument for buying the market is the historically strong performance following midterm elections.
The statistic getting the most attention is that the S&P 500 has been higher six and twelve months after each of the last 19 midterm elections.
That's impressive.
But it doesn't mean investors who bought immediately after the elections enjoyed a smooth ride to those gains.
For an active investor, the path the market takes can be just as important as where it ultimately ends up.
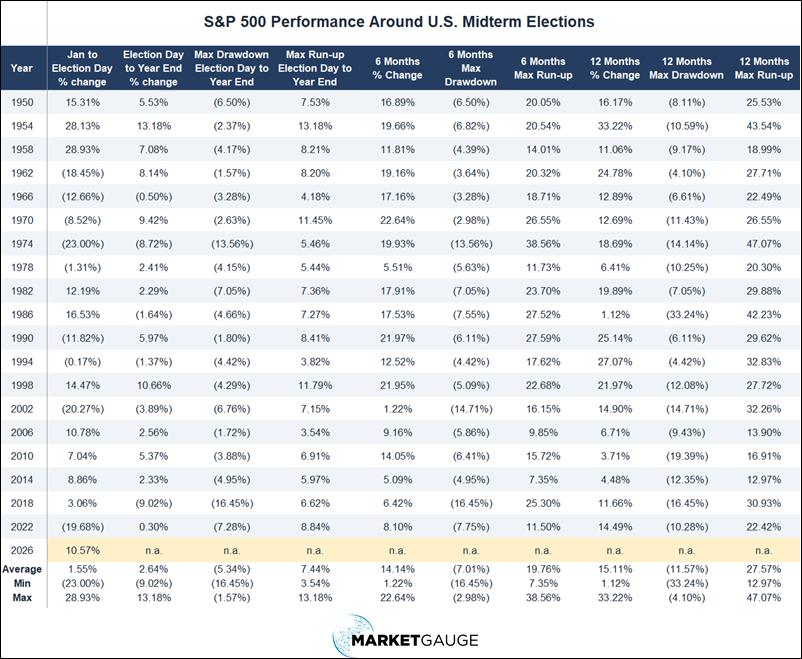
Our analysis of the period between midterm elections and year-end presents a less compelling picture.
Historically, the market has been positive approximately 68% of the time, with an average gain of roughly 2% to 2.5%.
However, the average maximum drawdown during that same period has been approximately 5%.
In other words, the average drawdown has been roughly twice the average gain.
There have also been substantially worse periods, including 2018, when the market experienced a particularly painful decline before year-end.
A historically normal correction can still be extraordinarily painful, and a historically bullish seasonal period can still produce substantial losses along the way.
These statistics don't invalidate the historically bullish post-midterm pattern. They simply demonstrate why investors shouldn't confuse favorable long-term probabilities with an absence of short-term risk.
And they reinforce the importance of knowing which of the two investment approaches described earlier you're following.
I began this article with the same observation that ended last week's discussion of the AI trade:
AI may still be in the early innings of its development, but for investors, the game has changed.
The fundamental drivers of AI adoption and infrastructure investment remain substantial.
The world will continue to need more computing power, data centers, energy, networking equipment, software, and countless other products and services that enable businesses to benefit from AI.
But that doesn't mean the stocks that led the previous phase of the AI bull market must lead the next one.
Nor does it mean that investors need to sit through a potentially prolonged semiconductor correction waiting for that leadership to return.
There are already signs that other areas of the market are capable of performing well despite semiconductor weakness.
RSP: The Key to the Broader Bull Market and Its Next Opportunities
For months, we've been emphasizing the importance of the equal-weight S&P 500 ETF (RSP).
While the cap-weighted S&P 500 and Nasdaq are heavily influenced by a relatively small group of large technology companies, RSP provides a clearer picture of the strength of the broader market.
Earlier this year, weakness in semiconductors did not prevent other sectors from performing well.
And despite Thursday's extraordinary decline, RSP has not suffered the same degree of technical damage as the semiconductor sector.
The area near 220 remains an important level to watch.
If RSP maintains its bullish trend, the broader market has an opportunity to stabilize and ultimately resume moving higher, even if SMH continues to struggle.
On the other hand, if RSP begins breaking down alongside SMH, SPY, and QQQ, we would have a much more serious problem.
That would suggest that selling pressure is spreading beyond the crowded AI trade and threatening the broader bull market.
Where Could the Next Opportunities Emerge?
The financial sector has shown encouraging signs of leadership, with improving momentum and relative strength.
Healthcare and biotechnology have also demonstrated the potential to develop substantial bullish trends.
Industrials may benefit from the continuing AI infrastructure investment cycle, while software, utilities, and energy could become increasingly important participants as the AI story evolves.
Even within technology, leadership can change.
The next phase of AI investment may reward companies that enable businesses to use AI profitably rather than those that simply supply the hardware necessary to build it.
None of these possibilities guarantees that the broader market will immediately recover.
But they provide compelling reasons not to assume that the breakdown in semiconductor stocks means the end of the bull market.
I expect the broader bull market to survive this correction.
That expectation depends heavily on whether leadership continues developing outside semiconductors and whether RSP can maintain its constructive trend.
If the market continues breaking down, we will respect that price action rather than attempt to predict a bottom.
But if Thursday's liquidation proves to be a cleansing event, and other sectors resume their bullish trends, there could be substantial opportunities ahead.
The AI revolution is far from over.
Semiconductors will have their day again.
But investors looking for the best opportunities over the next several weeks and months don't have to wait for SMH to return to its former glory.
The game has changed, and successful investors will recognize where the new leadership is emerging.
Most importantly, don't forget which approach to investing you're following. Market volatility will test your discipline, but it can also teach you how to become a better investor.
Want More MarketGauge?
If you’re an individual investor or an advisor, and would like help navigating the ever-changing dominant themes in the market with strategies, tools, automated trading systems or professional advisory services, contact us:
Best wishes for your trading,
Geoff Bysshe
Co-Founder
(Connect on LinkedIn)
 |
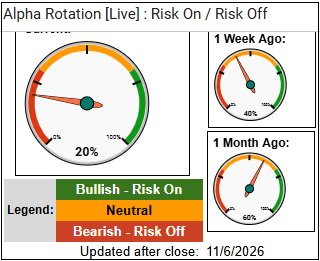 Every week we review the big picture of the market's technical condition as seen through the lens of our Big View data charts. The bullets provide a quick summary organized by conditions we see as being risk-on, risk-off, or neutral. The video analysis dives deeper. |
Summary: The balance of evidence favors a defensive stance despite selective pockets of equity strength.
Risk On
Neutral
Risk Off
**There will not be a video this week

Every week you'll gain actionable insight with: