November 1, 2026
Weekly Market Outlook
By Geoff Bysshe
It takes more than strong earnings to make a growth stock go higher. Investors need to expect the stock's growth story to attract new buyers going forward. This expectation is the "E" in the PRIME factors that drive durable trends.
Earnings season can strengthen or undermine investors' growth expectations. Last week, some of the biggest companies driving the AI capital expenditure boom delivered enormous numbers, but investors didn't like what those numbers suggested about future profitability.
Analysts love the baseball analogy that "AI is only in the third inning." After last week, the bulls might feel like the third inning ended with the heart of their lineup striking out.
AI may still be in the early innings of its development, but for investors, the game has changed.
To be clear, the numbers were big, but they depressed investors' sentiment.
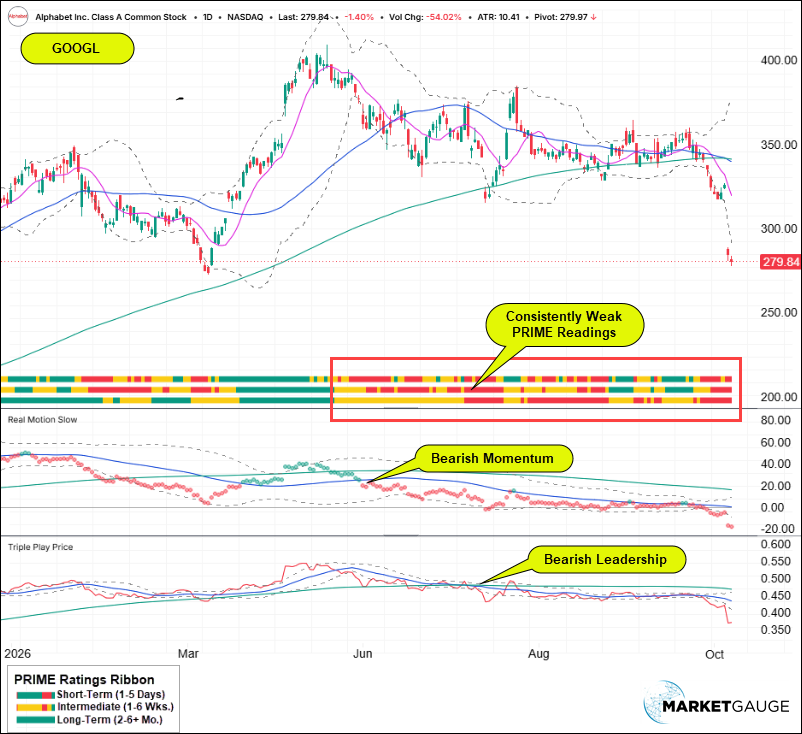
Alphabet suffered its worst single-day decline since going public in 2004. Intel plunged nearly 29%, its worst day since 1974. These reactions followed Meta's report that drove its stock down the most in a single day since July.
.
Last week was a good example of why the E, Expected Growth, in our PRIME analysis is so important.
Investors haven't necessarily lost faith in AI. They've lost confidence, at least for now, in the growth and profitability expectations that justified the valuations of some of AI's biggest players.
When profitability expectations get downgraded, growth stocks can struggle. When this happens after other important trend conditions have degraded, stocks collapse, and that's what happened to GOOGL and INTC.
PRIME evaluates the five factors that drive sustainable stock trends:
The first four factors help us understand what investors are doing with their money. The E helps us understand the fundamental expectations that can sustain a stock's trend by fueling the sentiment that can drive or derail the other four factors.
For much of the AI boom, investors rewarded hyperscalers for aggressively expanding their infrastructure. Massive capital spending was interpreted as evidence of extraordinary future growth opportunities.
AI infrastructure stocks were among the strongest in the market. Their price trends were extraordinary, institutional demand seemed insatiable, and momentum felt unstoppable.
But over time, these factors can cool off. Then they weaken. Eventually, the buyers who once rushed in on every pullback stop showing up.
Suddenly, news that would once have been dismissed as a temporary setback becomes a reason to sell.
For example, the big investments to dominate the AI-driven world are now labeled as risky expenditures that threaten future profitability and free cash flow.
The chart below shows this progression in GOOGL leading up to the gap down.
Click for a live chart of GOOGL
The promise of AI's potential has only gotten bigger. The demand for computing power hasn't disappeared.
What's changed over time has been investors' willingness to pay for the expected growth, and the strength of the trend in many stocks can no longer support "risky news."
.
Weak holders need to be washed out. New buyers at lower prices begin rebuilding confidence and stronger trends. If the fundamentals supporting the expected growth story continue to improve, the bulls can eventually regain control.
But that process takes time, and unexpected news can accelerate or delay it.
In last week's Market Outlook, "Is The Bull Market A Bargain or Broken?" I explained that even if the semiconductor ETF (SMH) continued to decline, its correction would only reach the average correction (35%) experienced by SMH since 2009, and the last two corrections have been over 40%.
Stay tuned. Measure the progress with the PRIME factors listed above and regularly shared here.
.
This bull market is bigger than the hyperscalers funding it, but there may also be a catch.
While investors are punishing these companies for spending so much money, that spending is helping fuel economic growth, and existing AI technologies are radically improving productivity.
The technology giants are collectively planning hundreds of billions of dollars in capital expenditures this year.
That money is creating demand for semiconductors, power generation, electrical equipment, cooling systems, construction, networking equipment and numerous other products and services.
Here's the catch: what investors increasingly view as a threat to the hyperscalers' future cash flow is creating revenue and earnings growth for other companies, while the technology being built is also creating opportunities for productivity gains.
And the economic impact is significant.
J.P. Morgan Asset Management estimated that AI-related investment contributed approximately 0.47 percentage points to U.S. real GDP growth over the preceding year, accounting for roughly one-fifth of total growth during that period.
Investors are worried that the hyperscalers are spending too much, but a significant reduction in that spending could create much bigger problems for the companies and industries benefiting from the investment boom.
It could also become a serious problem for the broader economy.
The biggest risk may not necessarily be the hyperscalers' declining free cash flow today, but rather what happens to economic growth if their capital spending boom comes to an end.
That's a risk we'll explore in future Market Outlooks.
For now, spending continues, and we'll focus on the leading indicators of that problem while opportunistically focusing on how the market is rotating into the companies benefiting from the spending.
How Long Will The Market Last Without Tech Leading?
If you’re in the SPY or QQQ, you need large-cap tech to perform.
Unfortunately, the hot growth stocks directly tied to the AI infrastructure buildout that have declining PRIME factors and high EPS expectations are at risk of collapsing with any disappointing earnings news.
Fortunately, there are individual stocks or other ETFs, that offer solid growth opportunities.
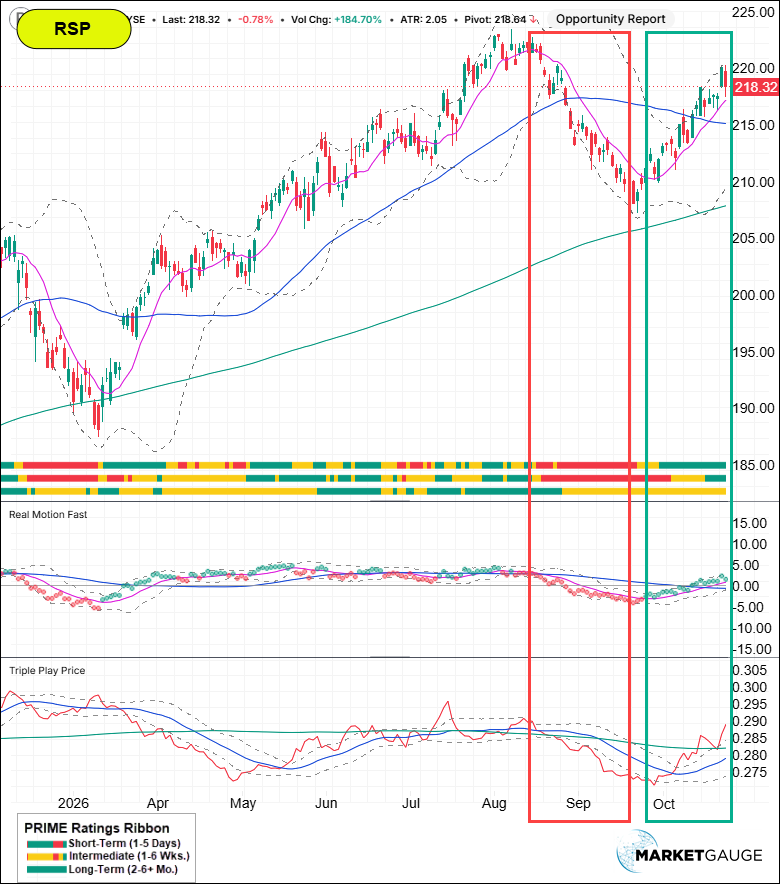
As we often mention here, the RSP (ETF for the equal-weight S&P 500) has been a good simple indicator for whether or not the market is correcting or becoming a bigger bear market threat.
While the S&P 500 declined about 1% in October, the RSP rose almost 5%.
In fact, 72% of the S&P 500 stocks were positive for the month of October.
As you can see in the chart of forward earnings below, earnings for the mid caps (SP 400) and small caps (SP 600) continue to rise.
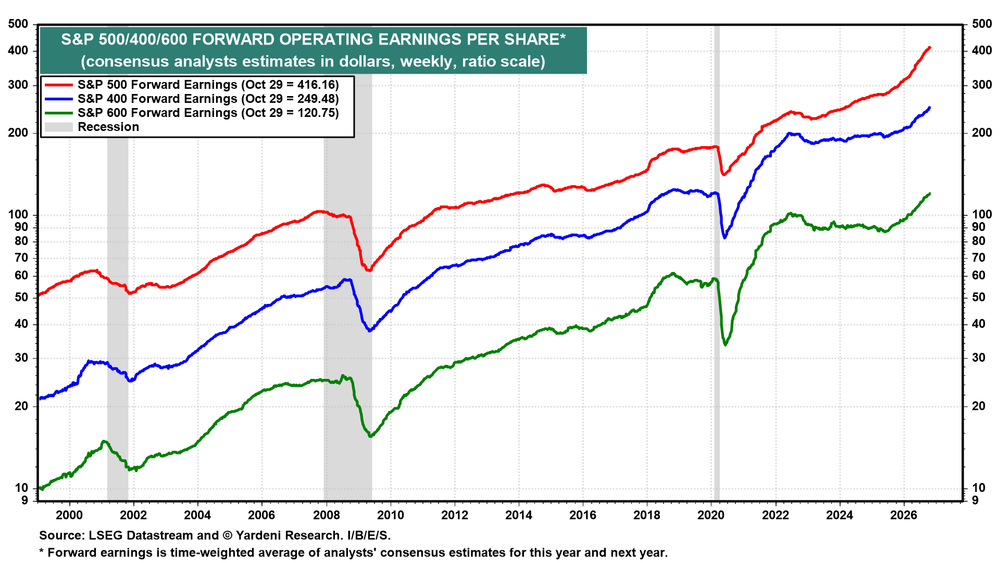
With earnings growth and positive PRIME factors as shown in the chart below, the RSP suggests there are an increasing number of bullish stocks support the bull market. If RSP, earnings expectations, and the PRIME factors all turn negative, along with the large-cap tech leaders, then investors should brace for a bear market.
In the chart below, look at how the indicators confirmed the market’s downturn from the highs in September, and then turned up, supporting the rally in October.
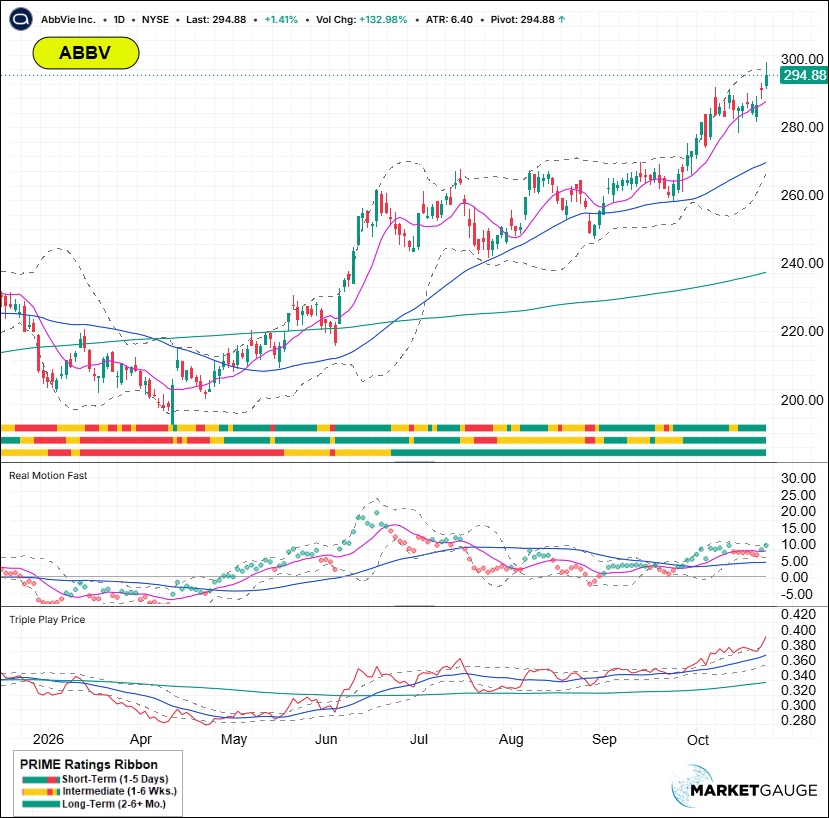
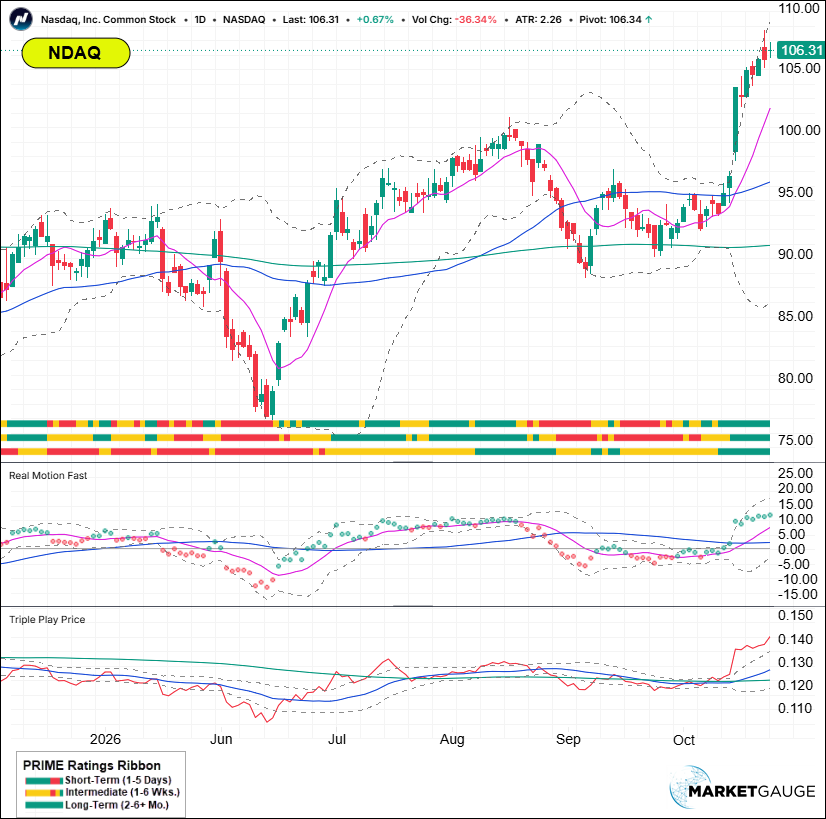
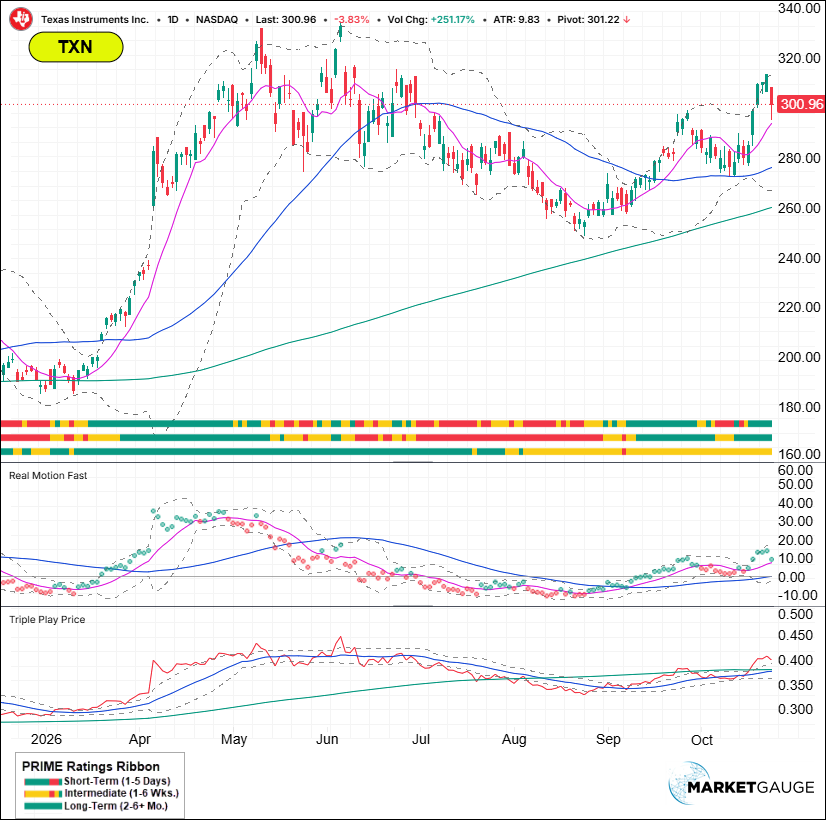
Below are a few stocks from various industry groups (including tech) that we’re following in our Active Investing Edge service with good PRIME trends.
Want More MarketGauge?
If you’re an individual investor or an advisor, and would like help navigating the ever-changing dominant themes in the market with strategies, tools, automated trading systems or professional advisory services, contact us:
Best wishes for your trading,
Geoff Bysshe
Co-Founder
(Connect on LinkedIn)
 |
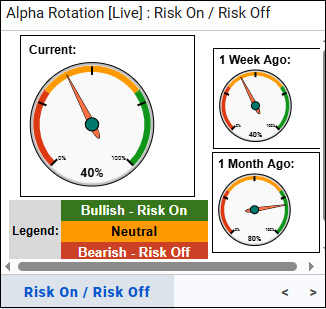 Every week we review the big picture of the market's technical condition as seen through the lens of our Big View data charts. The bullets provide a quick summary organized by conditions we see as being risk-on, risk-off, or neutral. The video analysis dives deeper. |
Summary: U.S. equities remain under pressure following a sharp Friday selloff, with elevated volatility, weakness in technology and semiconductors, and major indexes testing key support levels, particularly their 200-Day Moving Averages. However, improving market breadth, resilient internals, leadership from value stocks, recovering bonds, and favorable seasonal trends suggest underlying strength and the potential for a rebound, even as risk gauges remain cautious at 40%.
Risk On
Neutral
Risk Off
Maintain a defensive posture with reduced equity exposure and elevated cash levels while risk gauges remain at 40% and major indexes test their 200-Day Moving Averages. Favor relative strength in value stocks and sectors showing accumulation, while limiting exposure to technology, semiconductors, and emerging markets until they demonstrate renewed strength and reclaim key technical levels. Watch QQQ and IWM closely for a breakdown below their 200-Day Moving Averages, which would warrant further reductions in risk, while an oversold bounce accompanied by improving breadth and declining volatility could provide opportunities to selectively add exposure. Monitor the continued recovery in bonds as a potential tailwind for equities, and look for confirmation from market internals, volume, and price action before increasing allocations to take advantage of historically favorable year-end seasonality.

Every week you'll gain actionable insight with: