October 21, 2024
Mish's Daily
By Mish Schneider
I have commented but not focused too much on our Big Brother Biotechnology, IBB.
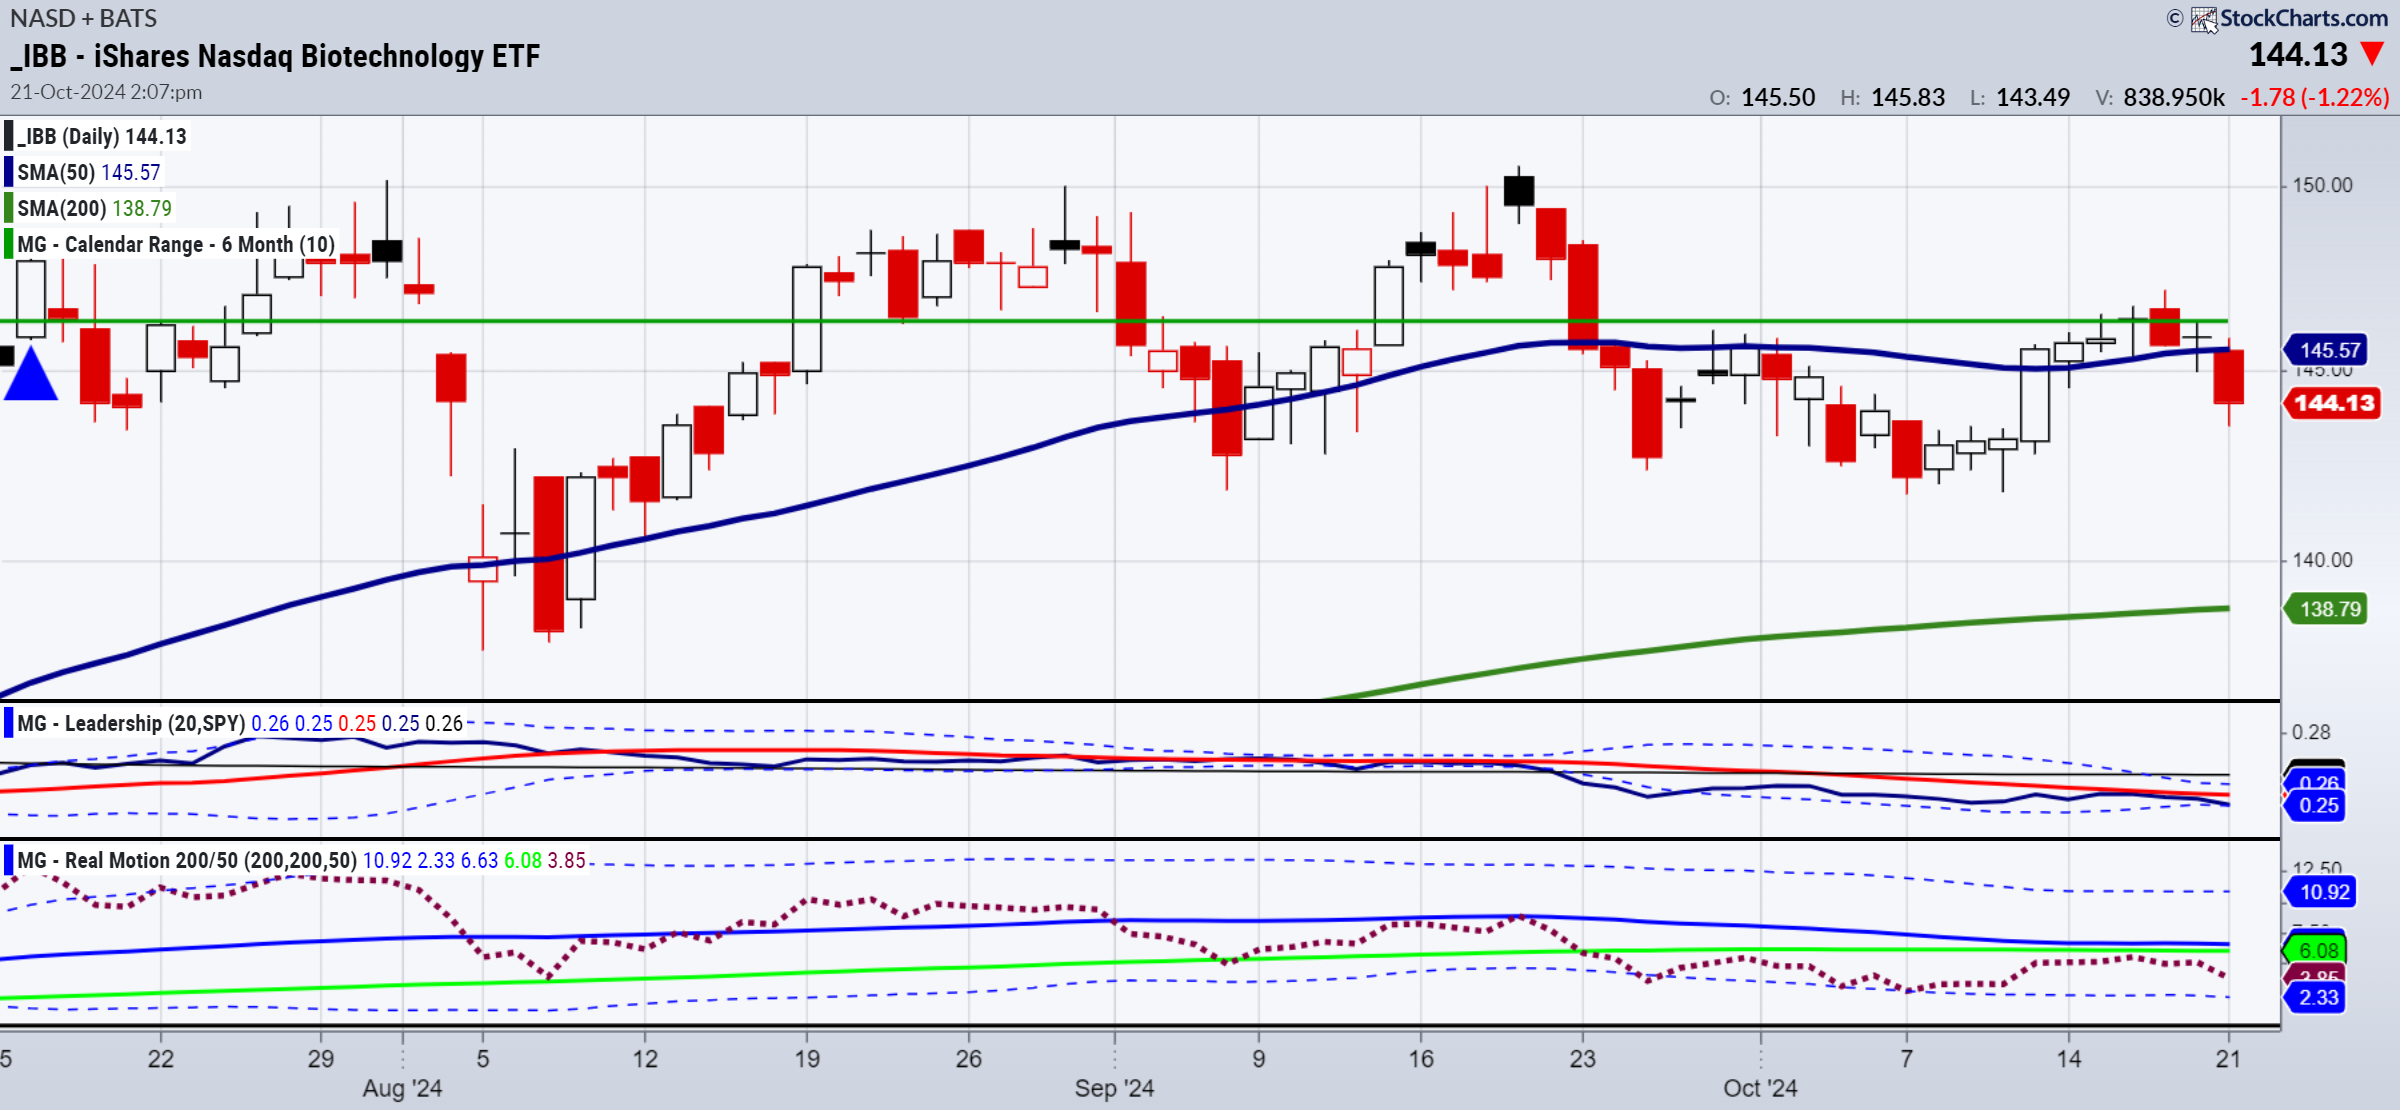
My weekend comments were, “IBB remains stuck in its weekly trading range. Remember, the longer the range sustains, the better the move out of it tends to be. IBB gets interesting over 150.”
So what about that trading range and current levels?
The Daily chart has several technical indicators.
I pick out this sector in the Economic Economic Modern Family as the weather gets colder.
We went to Costco this weekend, and the checkout person overheard me talking about buying toilet paper, or not buying it as they were out of Charmin.
She said, “You should buy what we have since its amazing if we have anything left as the return of Covid has folks hoarding the stuff again.”
What resonated with me was not the public hoarding mentality, but rather, the return of winter ills and chills.
What does this mean for Biotechnology (and I guess toilet paper as well)?
In the list of indicators, I draw your attention to Leadership.
From July until early August, IBB was outperforming the benchmark.
Since then, SPY has well outperformed.
While the price has not done too badly maintaining a trading range between 142-150, I am seeing that that wall of support since early August at 142 could be key.
Currently, IBB trades beneath the July calendar range high.
It has begun the week under the 50-DMA.
Momentum with the red dots under the 50 and 200-DMA shows a bearish divergence.
Yet, something about the chart looks compelling.
Clearly a breakout over 150 could be a game changer.
In the meantime, watch 142 to hold.
And have a look at this:

The last time IBB had a weekly golden cross was in 2017. After that the bull phase on the weekly charts lasted until October 2022 or exactly 2 years ago.
Now, a golden or bull cross looks like it’s ready to reemerge -with the price not too far from the moving averages for a relatively low risk.
Educational purposes only, not official trading advice.
For more detailed trading information about our blended models, tools, and trader education courses, contact Rob Quinn, our Chief Strategy Consultant, to learn more.
-

Traders World Fintech Awards
-
-----Get your copy of
Plant Your Money Tree: A Guide to Growing Your Wealth
Grow Your Wealth Today and Plant Your Money Tree!

"I grew my money tree and so can you!"- Mish Schneider
-
Mish in the Media-Want to see more? All clips here
ProInvestor Insights The Economic Economic Modern Family is Teaching Investors Patience IS a Virtue! 10-21-24
Business First AM Mish goes shopping and tells you how to pick a bottoming stock 10-21-24
Maggie Lake Is the Trump Trade Gathering Steam? 10-18-24
NYSE TV Mish covers the massive consolidation, gold and the need for more patience in stocks 10-18-24
Business First AM Mish takes you through the continued volatility in spite of a strong week in the market 10-18-24
Yahoo Finance Opening Bell Mish and Yahoo team discuss the small caps versus tech and they interest rates as the missing link 10-17-24
Stockpick.app Mish talks about the inflow of cash and sector rotation into Regional Banks 10-16-24
Real Vision Mish shares how to safeguard your investments and identify where to find opportunities amid the turmoil. 10-16-24
BNN Bloomberg Mish covers the importance of the retail and other sector rotations currently happening in the market 10-16-24
Coming Up:
October 21, 28 Podcast with Geoff Bysshe
October 24 Live Coaching
October 28 Benzinga Pre Market
October 29-November 4 Vacation
November 6 BFM Radio Singapore
November 7 CNA Asia First
November 18 Yahoo Finance
December 5-7, 2024 Money Show Master Class

Weekly: Business First AM, stockpick.app
ETF Summary
(Pivotal means short-term bullish above that level and bearish below)
S&P 500 (SPY) 575 support 585 resistance
Russell 2000 (IWM) 215 support 227 resistance
Dow (DIA) 435 next? If holds 425
Nasdaq (QQQ) 485 pivotal support 500 resistance
Regional banks (KRE) 60 pivotal
Semiconductors (SMH) 242 support 265 resistance
Transportation (IYT) 69.50 support
Biotechnology (IBB) 142 support zone 146.50 resistance
Retail (XRT) 78.99 would be the highest monthly close since 2022
iShares iBoxx Hi Yd Cor Bond ETF (HYG) 79.50 nearest key support

Every day you'll be prepared to trade with:


