April 27, 2023
Mish's Daily
By Mish Schneider
The PCE rises (although far from the 8% peak).
The GDP falls (is contraction of the economy over?
Meanwhile, stagflation persists along with the trading ranges in indices and many sectors.
Plus, the theory we have been expounding on (a 2-year business cycle within a longer 6–8-year business cycle) gets more relevant every week.
How long can this trading range continue for?
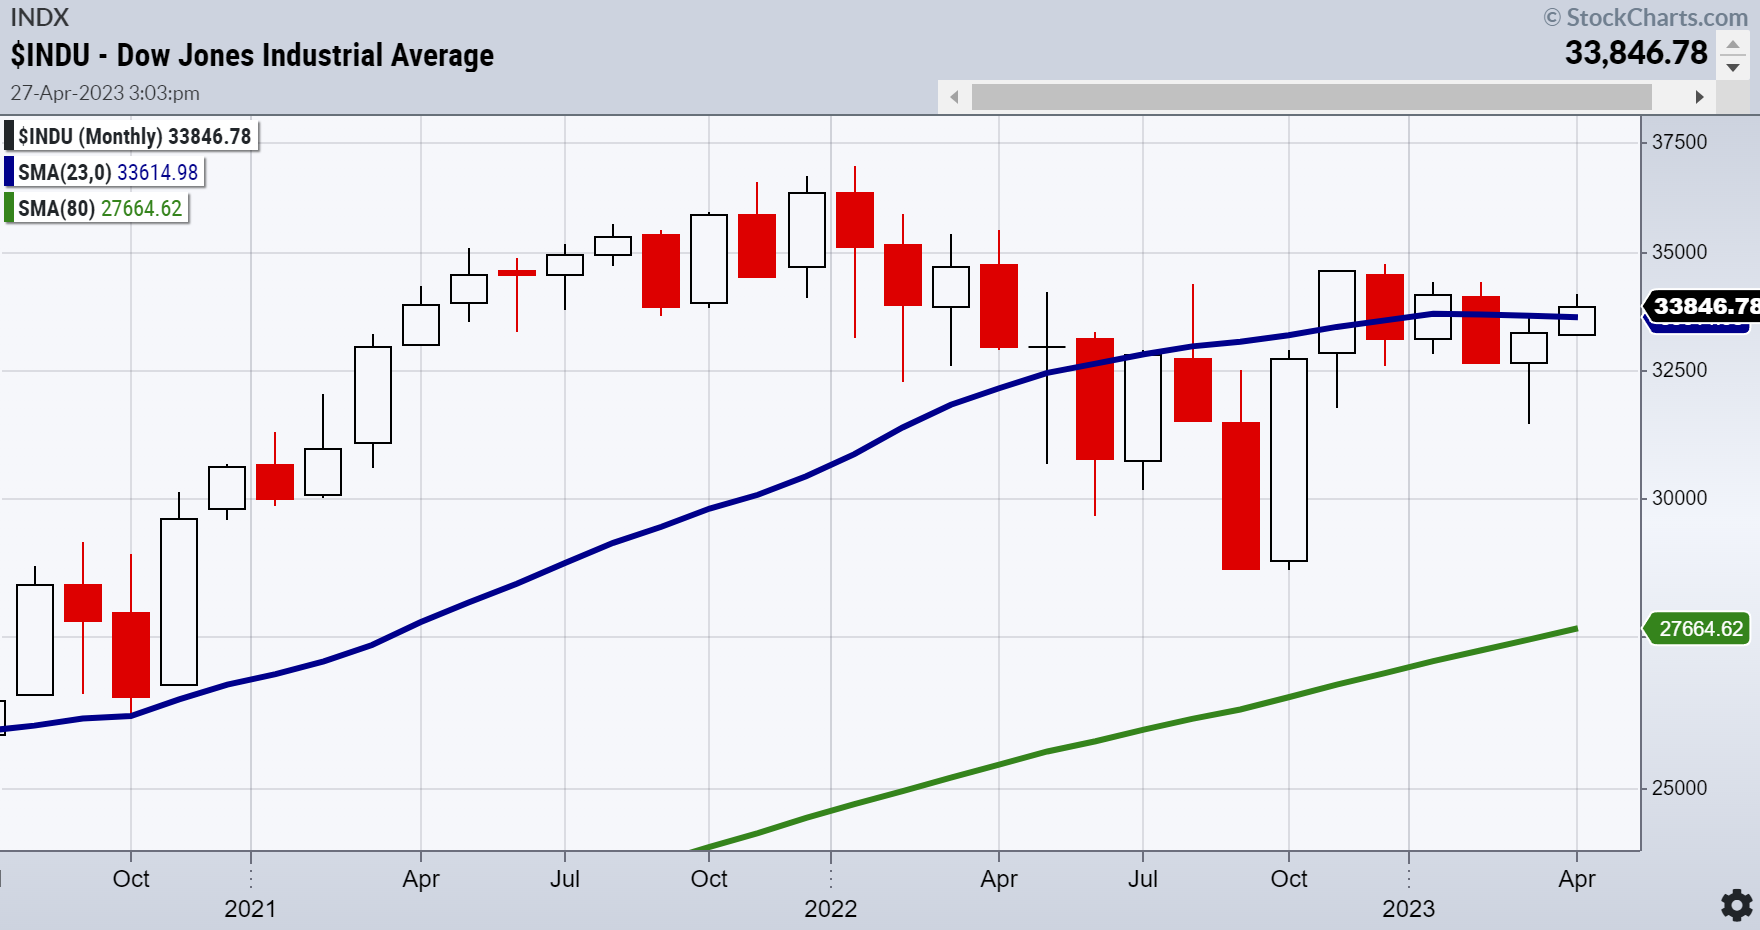
Looking at the Dow Jones Industrial Average, the range has been from $31,4239.82 to $34,342.32 in 2023.
Historically, we have seen the Dow remain rangebound for years (1968-1982).
In current times though, things move much faster.
The 23-month moving average is a shorter-term cycle within a longer-term cycle.
The DJIA is sitting right on the monthly MA-teasing investors during a tough time making a prediction of the next major moves.
With April about over, it will be fascinating to see if the DJIA closes above or below the blue line or 33,600.
It could be that the economy has contracted enough for now and will grow marginally.
It could also be that inflation peaked at 8% but could still have more upside.
There are many factors to consider such as geopolitics.
For now, we are accepting that stagflation remains the theme.
If so, we are looking at sectors outperforming the 2-year cycle showing expansion.
Interestingly, some growth stocks (META APPL MSFT), defense sectors (Raytheon RTX), consumer staples (PG, Walmart), global streaming stocks (FWONA) and as few commodities (GLD, SLV, Sugar) fit that bill.

Our NASDAQ All-Stars model has picked up on these growth stocks.
Now that META has wowed (and handily cleared the 23-month moving average), perhaps we will see the others join in as they get ready to report.
Here are the other positions relative to the 23-month MA.

For more detailed trading information about our blended models, tools, and trader education courses, contact Rob Quinn, our Chief Strategy Consultant, to learn more.
-
You don’t want to miss Mish's 2023 Market Outlook E-available now

NOT TOO LATE Click here if you'd like a complimentary copy of Mish's 2023 Market Outlook E-Book in your inbox.
Get your copy of
Plant Your Money Tree: A Guide to Growing Your Wealth
Grow Your Wealth Today and Plant Your Money Tree!

"I grew my money tree and so can you!"- Mish Schneider
-
Mish in the Media - All clips here
Making Money With Charles Payne 04-27-23
StockchartsTV Your Daily Five 04-21-23
Benzinga PreMarket Prep 04-20-23
Cheddar TV Closing Bell 04-19-23
The Money Show-Intro to Talk 04-19-23
CMC Market Tesla, Gold, Oil, Gas, China 04-19-23
Business First AM on Tax Season 04-18-23
Final Bar Stockcharts Dave Keller 04-13-23
Twitter Spaces Wolf_Financial Former Pit Traders 04-13-23
CMC Markets 04-12-23
Yahoo Finance 04-12-23
Special Webinar on What Traders Can Expect in 2023 with Bob Lang and Mish 04-11-23
Rosanna RoPodcast 04-07-23
-
Coming Up:
April 28 Live Coaching Complete Trader
April 28 TD Ameritrade with Nicole Petallides
May 2-5 StockChartsTV Market Outlook
* * * * * * * * ** * * * * * * * ** * * * * * ** * * * * * * * ** * * * * * ** * * * * * * * ** * * * * * ** * * * * * * * ** * * * * *
ETF Summary
S&P 500 (SPY) 23-month MA 420
Russell 2000 (IWM) 170 support - 180 resistance
Dow (DIA) Over the 23-month MA
Nasdaq (QQQ) 329 the 23-month MA
Regional banks (KRE) 43 now pivotal resistance
Semiconductors (SMH) 246 the 23-month MA
Transportation (IYT) 202-240 biggest range to watch
Biotechnology (IBB) 121-135 range to watch from monthly charts
Retail (XRT) 56-75 trading range to break one way or another

Every day you'll be prepared to trade with:


