July 19, 2026
Weekly Market Outlook
By Geoff Bysshe

Summary:
Last week, three forces shaping the market’s leading trends were on full display:
An extreme move in the energy crack spread. A widening divide between the winners and losers of the AI buildout. And a meaningful change in investors’ willingness to pay for technology growth.
None of these themes is new. We have covered each of them in recent weeks.
However, their impact on market conditions is becoming increasingly evident.
Investors Are No Longer Rewarding AI Earnings Growth
In last week’s Market Outlook, “When Great Earnings Become a Market Problem,” we suggested watching for bearish price action following bullish earnings reports.
The warning began with MU’s earnings in late June.
Despite reporting record earnings and operating margins, MU’s stock cracked lower. That reaction contributed to the bearish warning in the weekly SMH chart that we covered in “SMH Is Flashing an Ominous Warning Sign.”
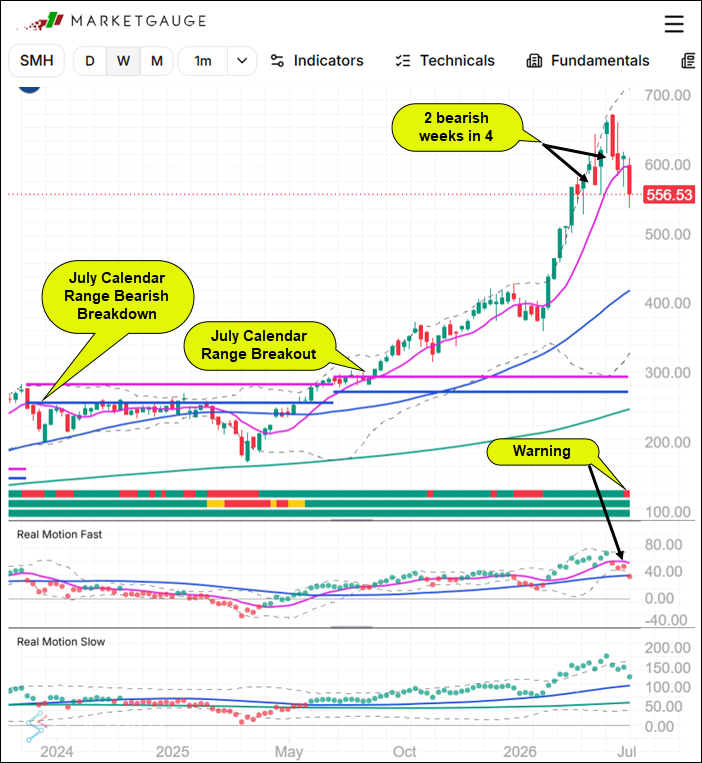
As you can see in the chart above, SMH’s short-term Real Motion momentum measure has turned bearish, along with its short-term MG PRIME ranking.
SMH has also closed below the low of its July Calendar Range on the daily chart. If that weakness continues, the breakdown will appear on the weekly chart next week.
This range deserves attention.
In 2024, the July Calendar Range identified the top in SMH. In 2025, it identified the resumption of the bull market following an eight-week consolidation.
I expect the July Calendar Range to be equally revealing this year.
Last week, TSM and ASML both delivered bullish “beat-and-raise” earnings reports.
Both companies exceeded earnings and revenue expectations. Both raised guidance. And both reinforced the strength of spending on the semiconductor infrastructure required to support the AI buildout.
Yet both stocks were met with bearish price action.
The media described these reactions as the companies failing to meet even higher investor expectations.
But the more important fact is much simpler:
Investors are selling good news.
That represents a meaningful change in the sentiment that has driven these stocks higher after earnings reports for many quarters.
Technology faces more headwinds than merely “peak expectations.”
Last week, IBM had its worst single-day decline (-25.2%) in its history, a clear demonstration that the divide between the AI winners and losers is likely to heat up.
IBM CEO Arvind Krishna made it clear who he felt the winners would be in the short term.
He explained that corporate technology budgets had been redirected toward the most urgent priorities, including servers, storage, memory, and cybersecurity.
That shift in spending left less money and attention available for some of IBM’s products and caused several large transactions to be deferred beyond the quarter.
IBM’s collapse clearly demonstrates that the divide between the winners and losers of the AI buildout is likely to become wider, and more consequential.
Meanwhile, TSM and ASML showed that spending on critical AI infrastructure remains strong.
The contrast is important.
Corporate spending has not disappeared. It has become increasingly concentrated in the areas considered most essential.
That concentration can continue to support selected industry groups while creating significant problems for companies that fall outside the market’s highest-priority spending categories.
These shifts make July especially important.
Earnings are revealing where corporate spending is becoming concentrated, while inflation data is revealing where price pressure may be hiding.
That brings us to the second major trend from last week.
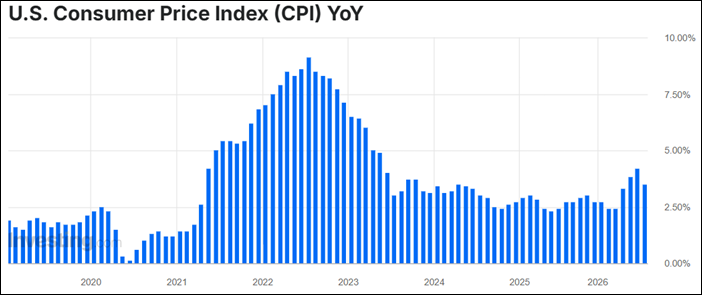
Last week’s CPI report looked encouraging, but its largest source of relief may already be reversing.
The headline decline sounded positive. However, in the context of the longer-term CPI chart, the improvement was less dramatic than it first appeared.
More importantly, gasoline prices fell 9.7%, making energy the primary driver of the decline.
The roughly 50% decline in crude oil prices from their mid-May peak suggested that additional inflation relief might follow.
However, the resumption of fighting between the United States and Iran sparked a two-week rally that pushed WTI crude from approximately $60 to nearly $90 per barrel.
Even more important, crude oil is not the price consumers pay.
Consumers buy gasoline, diesel, jet fuel, and other refined products.
Those prices can move very differently from crude oil.
Since the beginning of the war, crude oil has risen approximately 21%, while gasoline has remained about 33% higher.
Put another way, gasoline’s increase has been roughly 50% larger than crude oil’s.
That difference is where the crack spread becomes important.
What the 3-2-1 Crack Spread Measures
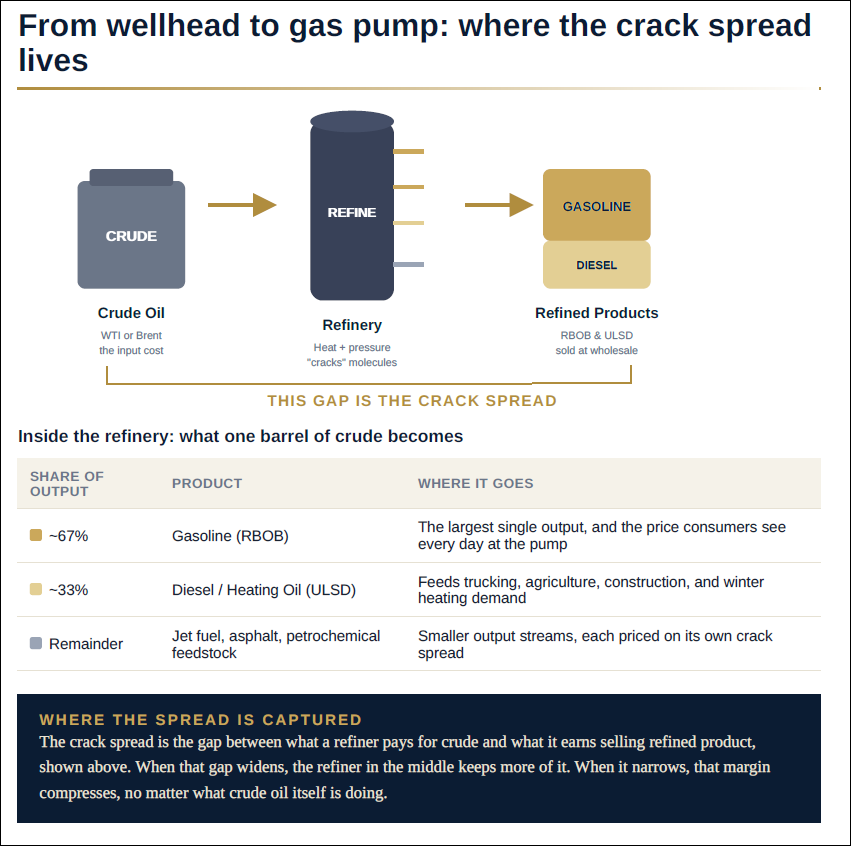
A refinery buys crude oil and converts it into finished products such as gasoline, diesel, and jet fuel.
The difference between what the refinery pays for crude oil and the market value of the products it produces is called the crack spread.
The commonly followed 3-2-1 crack spread assumes that three barrels of crude produce approximately two barrels of gasoline and one barrel of diesel.
In simple terms, the crack spread is a rough measure of refinery profitability—and an important indicator of pressure on consumer fuel prices.
Here is a quick explanation of the Crack Spread.
If you’d like a more detailed explanation, I created a tutorial PDF here.
Because the forces affecting crude oil prices are similar—but not identical—to those affecting gasoline and diesel, the spread can vary widely.
When refined-product prices rise faster than crude oil, refinery margins expand.
When the spread narrows, those margins contract.
Currently, the 3-2-1 crack spread is at a historically high level, with direct implications for inflation, consumer fuel costs, and the earnings potential of refining companies.
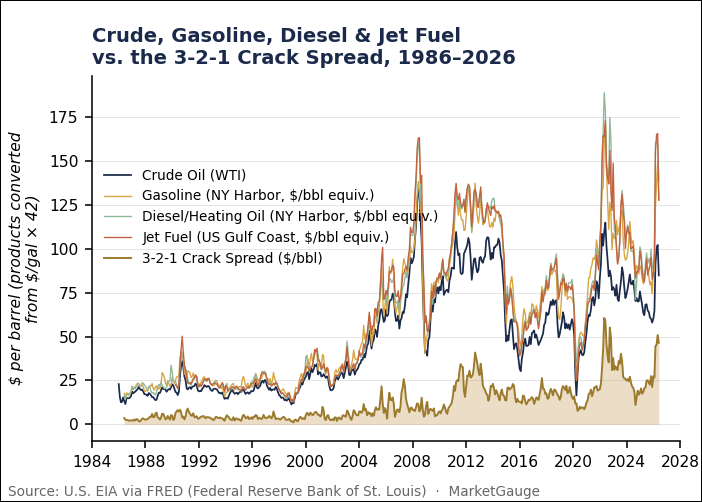
The long-term chart below shows how crude oil, refined products, and the crack spread have moved over time.
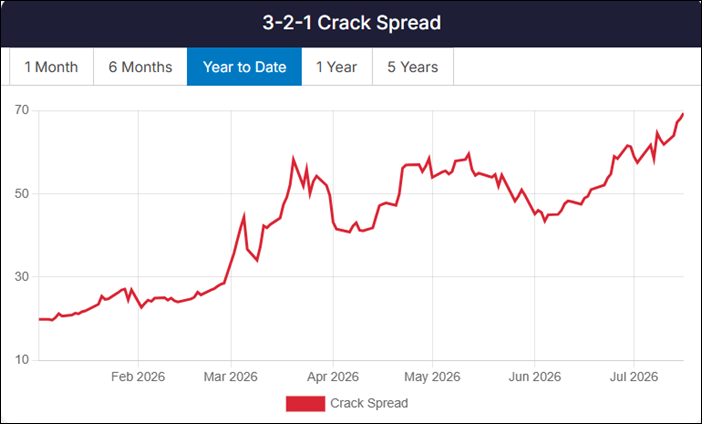
As of June 1, 2026, the spread was already near $50 per barrel.
Since then, it has accelerated sharply and reached a new all-time high.
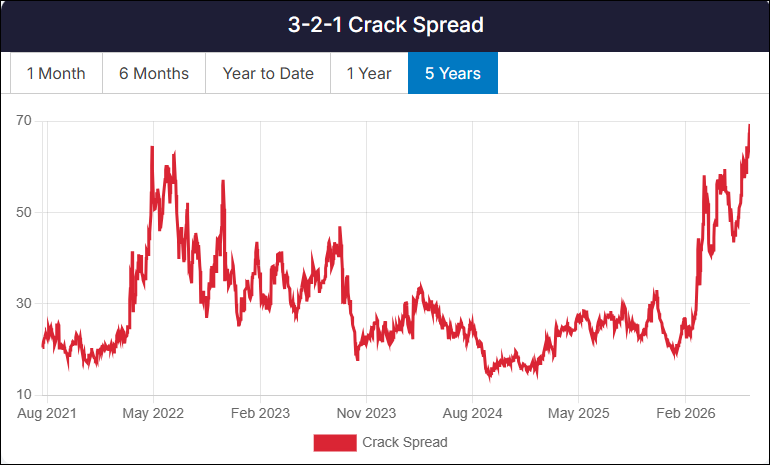
The shorter-term charts make the speed of the move even clearer.
The five-year chart shows that the spread has moved above the extreme levels reached in 2022.
The year-to-date chart shows how rapidly it has accelerated since its early-June low.
(You can follow it here: https://rbnenergy.com/market-data/3-2-1-crack-spread.)
The record crack spread suggests that refined-product prices may remain under pressure even if crude oil stops rising.
It may also complicate the market’s assumption that the latest CPI report marks the beginning of a sustained decline in inflation.
The chart below compares the 3-2-1 crack spread with year-over-year CPI.
It highlights periods when the spread moved above $30 and then began to decline.
Historically, inflation has often declined after an elevated crack spread peaks and begins to fall.
The relationship is not immediate or perfect. In 2008, inflation initially continued higher even after the spread began to decline.
However, the chart also shows a positive relationship between inflation and the crack spread during many of the periods leading into the peaks.
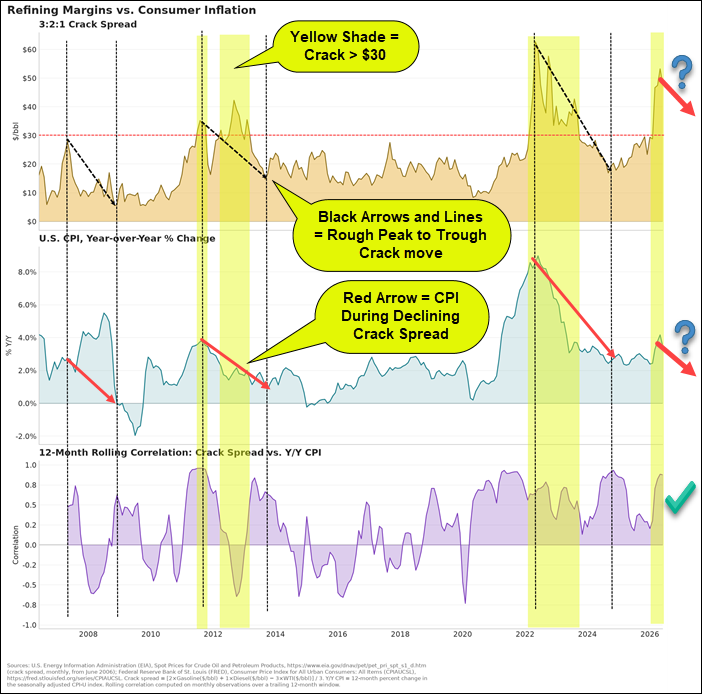
Given the spread’s new highs since June, last week’s cooler inflation reading may be difficult to repeat in the coming months.
At the same time, the spread has reached a level from which it has previously peaked.
That creates two important possibilities:
For now, however, the record level of the spread argues against assuming that one favorable CPI report has resolved the inflation problem.
The crack spread is not only an inflation signal.
It is also signal trading opportunities.
The energy groups most closely linked to the crack spread tend to perform well when refinery margins are rising or remain elevated.
The clearest beneficiaries are refiners such as:
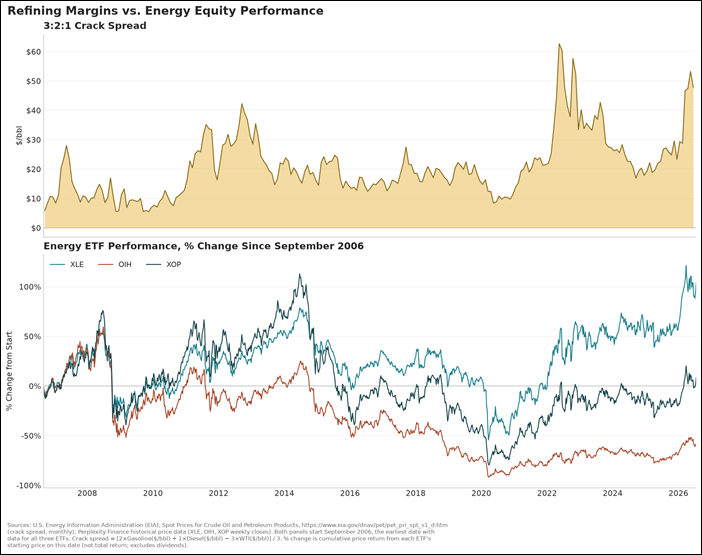
The industry group most directly correlated with the crack spread is refining.
The chart below shows that VLO, MPC, and PSX have historically performed well during sustained periods of elevated crack spreads.
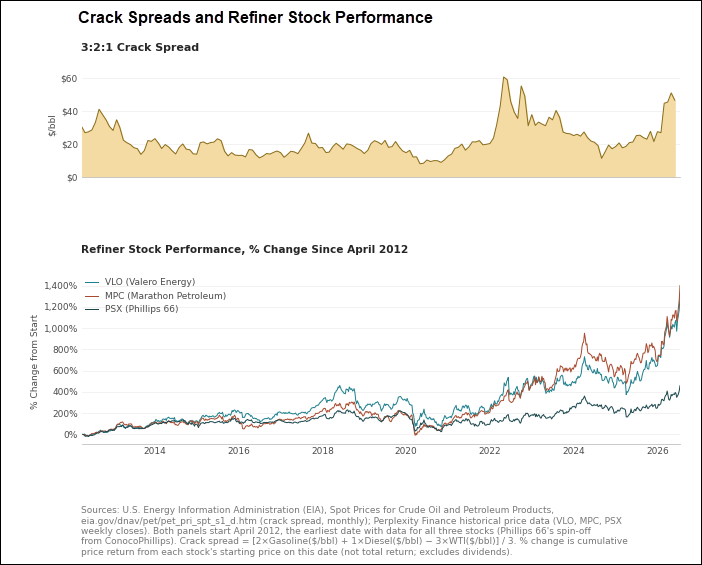
Their YTD performance has been:
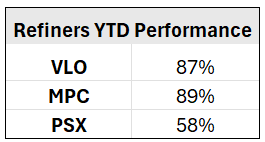
Those gains reflect more than a general rise in energy stocks.
They show how the market is rewarding companies positioned to benefit directly from the extreme spread between crude oil and refined-product prices.
Last week delivered two important warnings.
In technology, investors sold strong earnings reports from TSM, and ASML, while IBM’s historic decline demonstrated how sharply corporate spending is separating AI winners from losers.
In energy, the record 3-2-1 crack spread suggests that the recent relief in inflation may be difficult to sustain.
The current level of the spread is likely to:
Both developments point to the same market environment:
Tech leadership is narrowing, and the consequences of being positioned in the wrong industry group are becoming more severe.
That makes earnings reactions, the July Calendar Range, and the 3-2-1 crack spread three especially important conditions to monitor in the weeks ahead.
The crack spread may also play an important role in determining whether the Fed will be in a position to cut rates while it remains focused on inflation.
Stay On Top Of The Market For Yourself or Your Clients
If you'd like access to the MarketGauge indicators, strategies, automated trading models, and more, contact us.
Best wishes for your trading,
Geoff Bysshe
Co-Founder
(Connect on LinkedIn)
 |
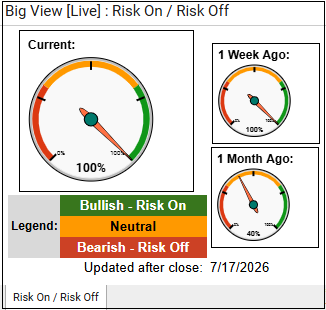 Every week we review the big picture of the market's technical condition as seen through the lens of our Big View data charts. Every week we review the big picture of the market's technical condition as seen through the lens of our Big View data charts.
The bullets provide a quick summary organized by conditions we see as being risk-on, risk-off, or neutral. The video analysis dives deeper. |
Summary: Despite a sharp selloff led by technology that pushed the SPY and QQQ below their 50-day moving averages, the broader market remains in a cautiously constructive position as market internals, the 52-week new high/new low ratio, intermarket risk gauges, and most members of the Modern Family continue to support a longer-term risk-on backdrop. However, weakening leadership in growth and semiconductors, deteriorating QQQ internals, defensive sector leadership, rising volatility, higher oil prices amid Middle East tensions, and softer foreign markets suggest risk is increasing and investors should closely watch key support levels and intermarket relationships for signs of a more meaningful shift toward risk-off.
Risk On
Neutral
Risk-off

Every week you'll gain actionable insight with: