July 12, 2026
Weekly Market Outlook
By Geoff Bysshe
Summary
The Market's Biggest Strength May Be Quietly Becoming Its Biggest Risk
Despite a war in the Middle East, rising inflation expectations, weaker GDP forecasts, and a market that has gone from expecting interest rate cuts to expecting rate hikes, stocks have continued climbing.
Investors have driven the market higher on the belief corporate earnings will continue to exceed expectations.
As earnings season begins, that belief may become the market's next major test.
The bull market has spent much of the first half of the year looking past geopolitical tensions and economic uncertainty because investors have remained focused on one powerful narrative: the AI buildout and the continued acceleration of corporate earnings.
The question now is whether that narrative can continue carrying the market higher.
The Economic Backdrop Has Become More Challenging
Since the conflict with Iran began, inflation expectations have moved higher while GDP forecasts have continued to move lower.
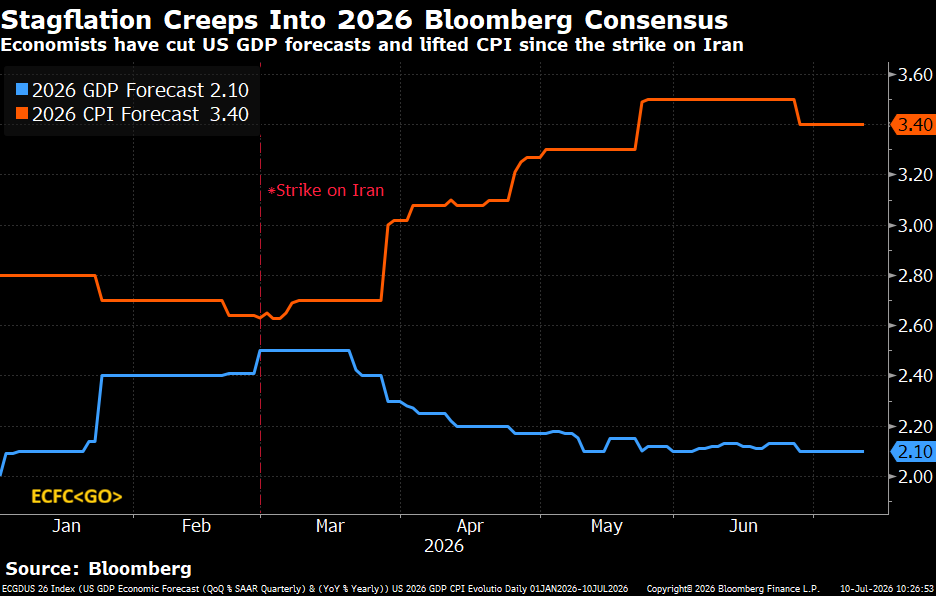
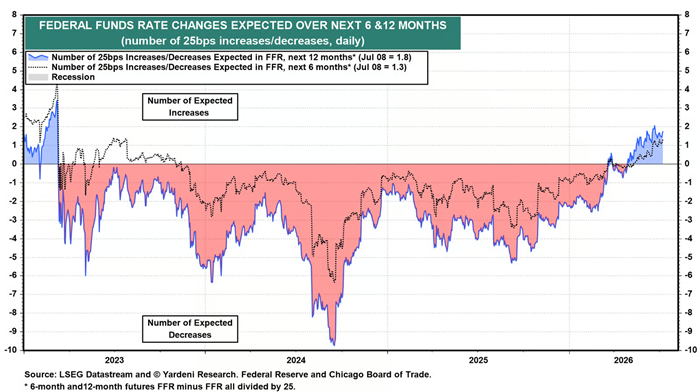
At the same time, interest rate expectations have changed dramatically.
Earlier this year, investors expected the Federal Reserve to lower rates over the coming twelve months. Today, markets are pricing in the possibility of rate hikes instead.
.
Whether those expectations ultimately prove correct isn't the point.
The point is that the macroeconomic backdrop has become materially less supportive than it was just a few months ago.
Yet the market continues to rally.
Can Earnings Continue Carrying the Market?
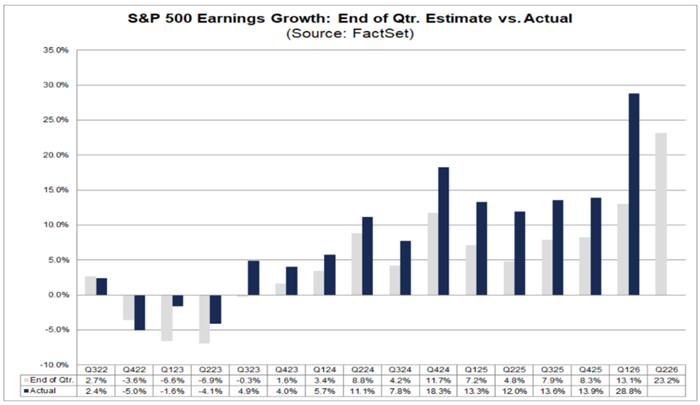
The FactSet data below shows that reported earnings have topped estimates every quarter since early 2023. Even more impressive, analysts have continued raising forward earnings expectations, creating one of the strongest earnings environments of this bull market.
Historical price action suggests investors are right to be optimistic.
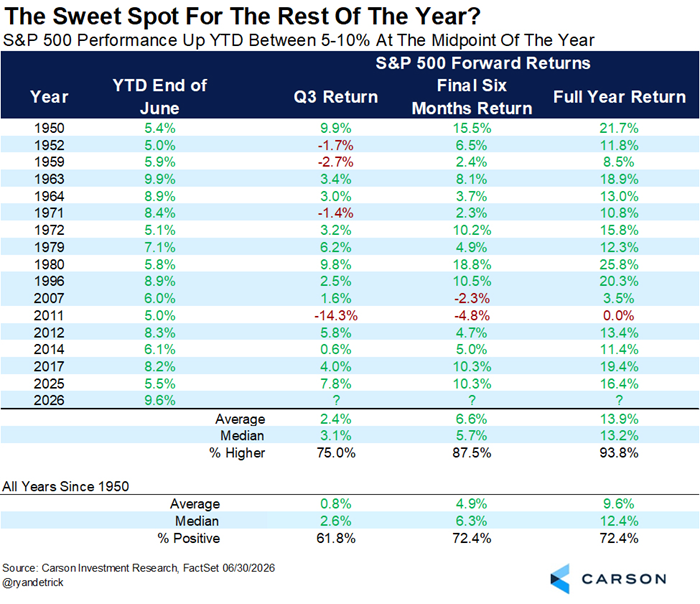
Ryan Detrick of Carson Group points out that when the S&P 500 finishes the first half of the year up between 5% and 10%, the second half has historically continued higher roughly three-quarters of the time.
.
That’s an impressive historical statistic, but it can mask a bumpy ride to the end of the year.
Wall Street has a habit of taking good news to extremes before eventually becoming disappointed.
The dramatic increase in both earnings estimates and reported earnings leaves the market vulnerable to a familiar narrative shift.
Instead of asking whether earnings are good, investors begin asking whether they can get any better.
That's when phrases like "peak earnings," "as good as it gets," and "missed expectations" begin appearing in financial headlines.
Watch How Stocks React—Not Just What They Report
One of the most important things investors should watch over the coming weeks isn't simply whether companies beat earnings estimates.
It's how stocks react after they do.
If technology stocks begin selling despite reporting strong earnings, investors may quickly shift the narrative from "better than expected" to "peak earnings."
That shift in expectations often matters more than the earnings themselves because markets generally react to changes in future expectations rather than results that have already been reported.
Fortunately, today's market is broad and healthy.
Sector rotation has remained healthy throughout this advance.
If technology begins struggling under the weight of elevated expectations, sectors such as Industrials, Financials, Healthcare, or Energy could assume greater leadership and help extend the broader bull market.
That possibility makes sector rotation one of the most important themes to monitor during earnings season.
When Expectations Change, Let Price Be Your Guide
Markets rarely change because the facts suddenly change.
They change because investors begin interpreting the same facts differently.
Rather than trying to predict exactly when that shift in psychology will occur, we prefer to let price tell us when expectations have actually changed.
One of the simplest ways we've found to do that is the July Calendar Range.
After the market closes on July 15th, we'll define the high and low established during July up to that point.
Those two levels become an objective roadmap for the second half of the year.
A market holding above the July low maintains a constructive outlook.
A decisive break below that level suggests expectations—and potentially the market narrative—are beginning to change.
Likewise, a move above the July high would reinforce the bullish case.
A simple explanation for why this simple indicator can be so effective is that, as the market moves into the second half of the year, analysts start to focus on expectations for year-end estimates. If or when expectations for the end of the year become less rosy than they began the year, this weighs on prices.
Additionally, the second half of the year increases the investor’s focus on the following year, which can lead to a shift in market behavior.
However, the best explanation for how and why it works is to simply look at how it has worked on the charts.
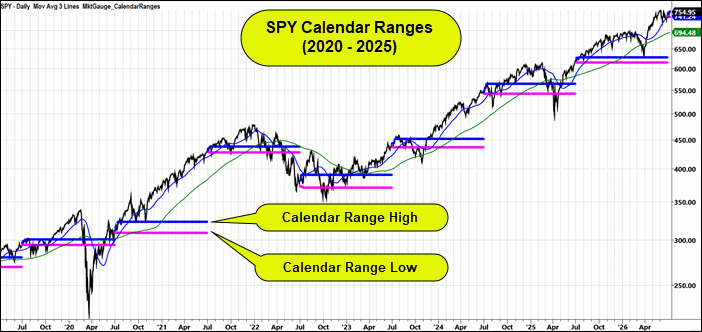
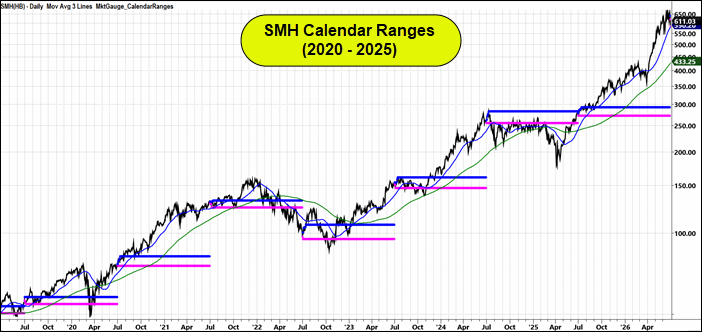
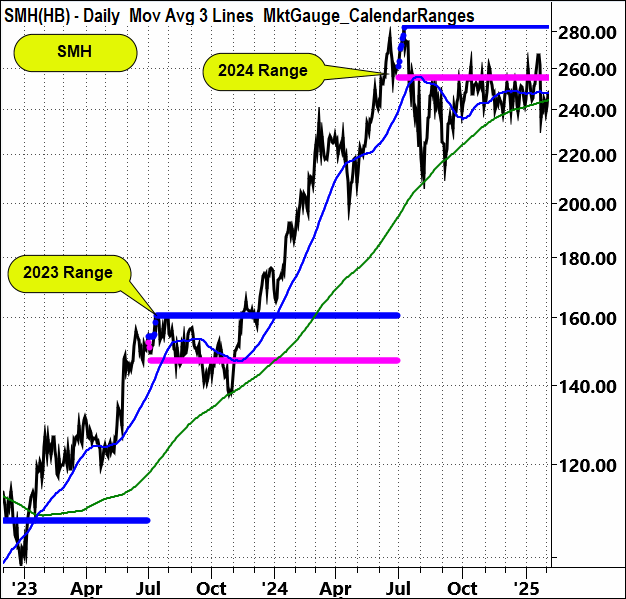
The magenta and blue lines on this chart of the S&P 500 represent the July Calendar Range low and high carried out for 12 months.
Note that when a market trades under the magenta line, you're generally best served to have a bearish bias until it recovers.
SPY
SMH
Below you’ll see the periods of 2023-2024 in more detail.
SPY
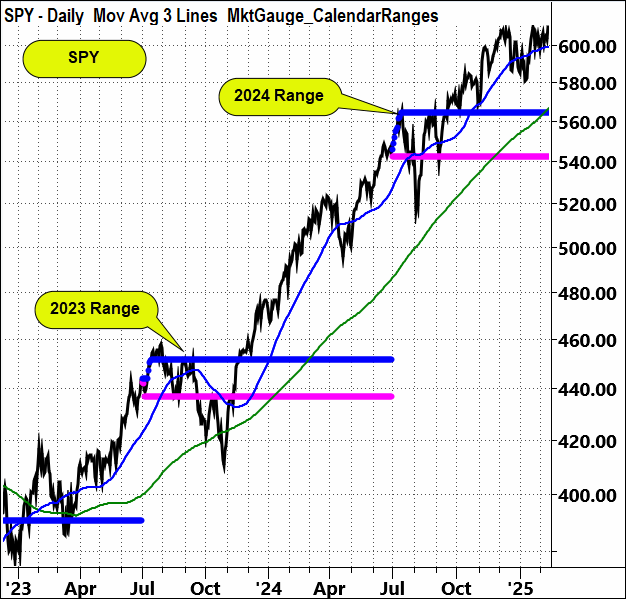
SMH: Notice how the SMH does not recover in 2024, but the SPY above does.
Conclusion
The fundamental backdrop remains constructive.
Corporate earnings continue to grow, sector rotation remains healthy, and history suggests investors should not underestimate the strength of a bull market that has already produced solid first-half gains.
At the same time, expectations have become exceptionally high.
The market is now balancing rising inflation, slower economic growth, and higher interest-rate expectations against one powerful belief—that corporate earnings can continue exceeding already lofty forecasts.
If that belief holds, the bull market can continue.
If strong earnings begin producing weak stock-price reactions, it may be the first sign that expectations have finally outrun reality.
Rather than trying to predict which outcome will unfold, we'll continue to let price guide us.
As the July Calendar Range develops over the coming weeks, it will provide a simple, objective framework for determining whether this bull market is continuing to strengthen—or whether the market's biggest strength has finally become its biggest risk.
Stay On Top Of The Market For Yourself or Your Clients
If you'd like access to the MarketGauge indicators, strategies, automated trading models, and more, contact us.
Best wishes for your trading,
Geoff Bysshe
Co-Founder
(Connect on LinkedIn)
 |
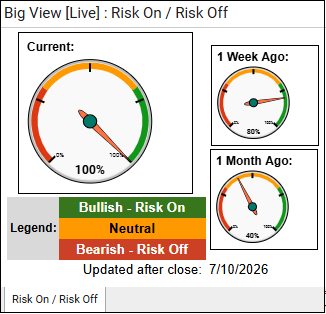 Every week we review the big picture of the market's technical condition as seen through the lens of our Big View data charts. Every week we review the big picture of the market's technical condition as seen through the lens of our Big View data charts.
The bullets provide a quick summary organized by conditions we see as being risk-on, risk-off, or neutral. The video analysis dives deeper. |
Summary: Markets remain firmly risk-on, with QQQ leading, all major indexes in bull phases, risk gauges at 100%, volatility at its lowest level since early January, and renewed leadership from growth, technology, consumer discretionary, and global cyclicals tied to improving trade and growth expectations. However, weak volume, softer momentum, diverging internals, and major indexes still below their June highs suggest the advance may face near-term resistance, while elevated rates remain the clearest risk to the otherwise bullish seasonal backdrop.
Risk On
Neutral
Risk-off

Every week you'll gain actionable insight with: