June 28, 2026
Weekly Market Outlook
By Geoff Bysshe

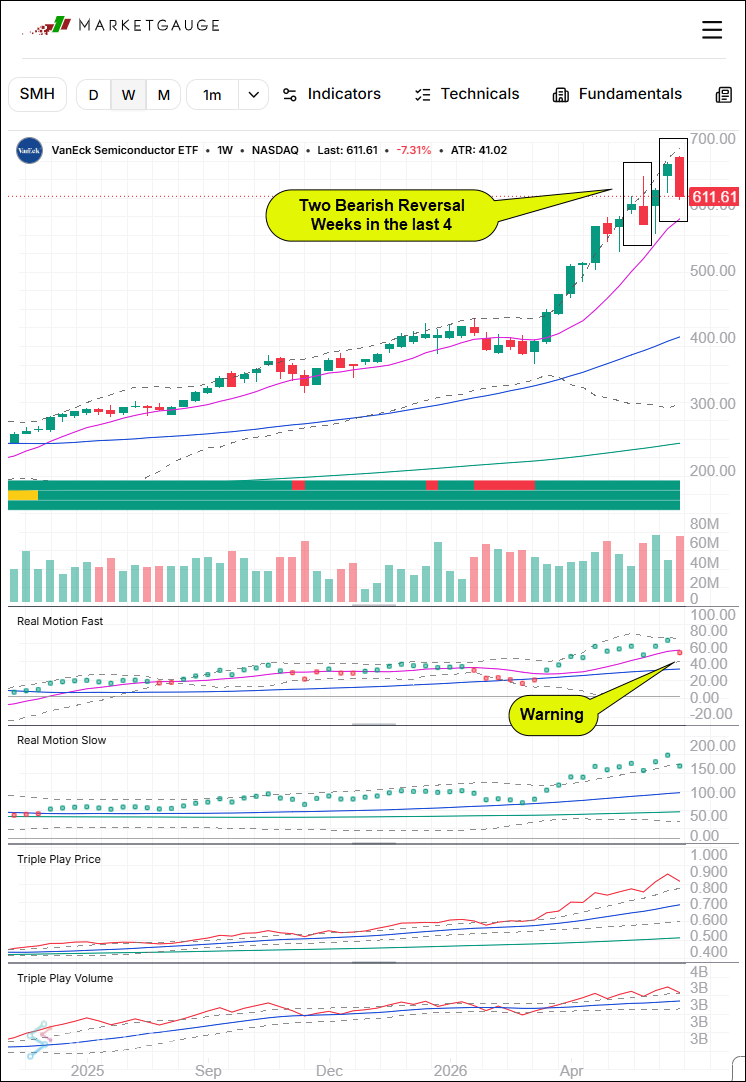
The market’s leading sector, Semiconductors, SMH, closed the week below its prior week after trading at all-time highs. This is the second week in the last four that this key reversal pattern has shown up.
When this pattern follows through (trades lower through significant support), it can indicate a significant top is in place for at least weeks.
The patterns and our Real Motion momentum indicator with an early cautionary reading are illustrated on the weekly chart below.
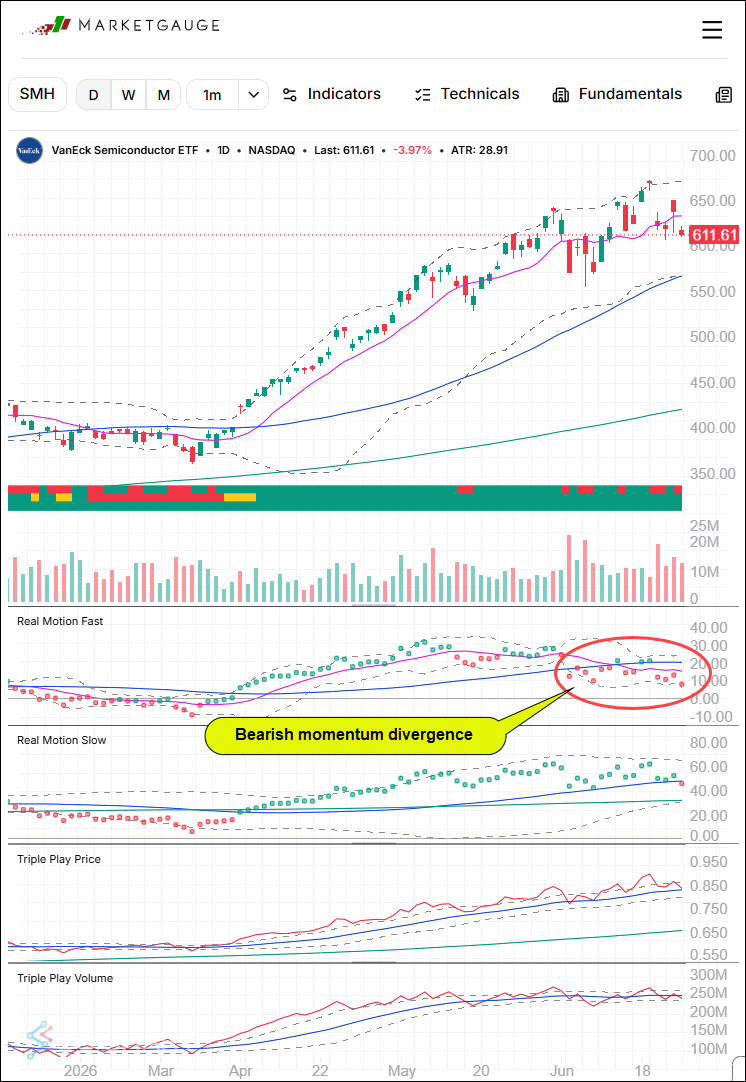
The patterns on the daily chart (shown below) have also been warning that SMH needs a break from its rapid ascent.
The most concerning condition is the daily bearish divergence in the Real Motion momentum indicator which was hardly able to trade over its 50-day average (blue) while the SMH closed several times at new all-time highs.
The moving averages of Fast Real Motion are also negatively stacked which typically indicates a resumption of the short-term down trend in momentum combined with price breaking support will lead to a correction in the SMH price trend.
I’m expecting the $600 price level in SMH to be that deciding support level.
The SMH Isn’t The Most Important Factor
In Determining the Health of The Bull Market
The SMH is the leading sector and it carries a lot of weight within the SPY and QQQ, which is what most people will focus on when measuring the health of “market”, but the current market conditions have demonstrated that these indexes could correct without killing the bull market.
In fact, a correction in all three could be a welcome, healthy development for the health of the bull market in the second half of the year and beyond.
Not surprisingly, this potential correction is setting up to happen in July, which is a very common month for corrections and for big trend-resuming breakouts to occur.
The July Factor
July often creates infection points in market trends – indexes, sectors, and stocks. This year, the conditions are ripe for both reversals (SMH) and breakouts in several sectors.
**The rest of the commentary will be posted later tonight.
 |
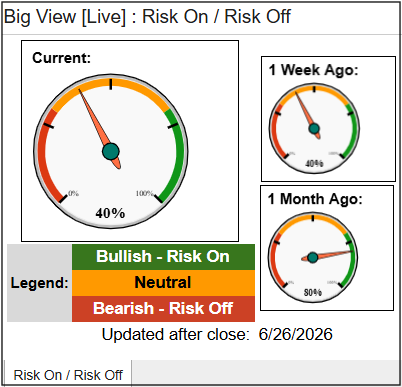 Every week we review the big picture of the market's technical condition as seen through the lens of our Big View data charts. Every week we review the big picture of the market's technical condition as seen through the lens of our Big View data charts.
The bullets provide a quick summary organized by conditions we see as being risk-on, risk-off, or neutral. The video analysis dives deeper. |
Summary: Markets remain in a cautiously bullish environment, with improving internals, easing rates, positive breadth, and a strong Modern Family signaling healthy participation beneath the surface despite weakness in the SPY and QQQ. While volume trends, growth leadership, and volatility warrant some caution, the overall evidence continues to favor a modest risk-on stance with supportive seasonality through the end of July.
Risk On
Neutral
Maintain a modest risk-on posture while remaining selective, as improving market internals, easing rates, healthy leadership rotation, and favorable seasonality continue to support the broader bull market despite weakness in the SPY and QQQ. Focus new exposure on areas showing relative strength—including small caps, value, healthcare, and the strongest Modern Family components—while using the SPY's 50-Day Moving Average and recent trading range as key risk management levels, becoming more defensive if breadth deteriorates or the SPY breaks convincingly below recent support.

Every week you'll gain actionable insight with: