July 5, 2026
Weekly Market Outlook
By Geoff Bysshe

The bearish fears surrounding the SPY as it tests its 50-day moving average are well grounded if you look beneath the surface of the major indexes.
For example, the MAG 7 darlings of the recent past are now being referred to by many on Wall Street as the "Lag 7."
Additionally, the SMH sector that replaced the MAG 7 as the market’s favorite bull market engine is showing ominous signs of weakness.
Last week’s Market Outlook noted that SMH (semiconductors), the sector many investors consider the bull market's primary engine, had a bearish pattern on its weekly chart. It subsequently tried to rally only to roll over and close down 4% in a holiday-shortened week.
For market timers, weakness in a leading sector is concerning. A bearish divergence in that leading sector is even more concerning.
However, despite the fact that the fate of the market’s most influential indexes, SPY and QQQ, has been tied to the performance of their large-cap tech stocks for years, the bull market may not be in as much trouble as many think.
Two Bearish Tech Divergences
The SPY and QQQ hit their closing all-time highs on June 2nd led by the SMH (semiconductors) sector. It was a move extended over their previous swing highs on May 14th.
At that time, the Mag 7 ETF, MAGS, developed a bearish divergence by failing to climb over its May 14th high as shown in the chart below.
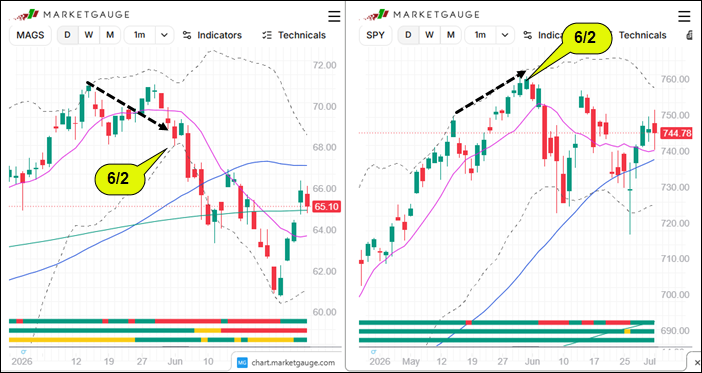
It was clear that SMH was now the bulls’ engine. After the early June small crack in the bull trends, the SMH powered to new highs again until June 22nd.
However, this time the SPY was the bearish divergence, as you can see in the chart below.
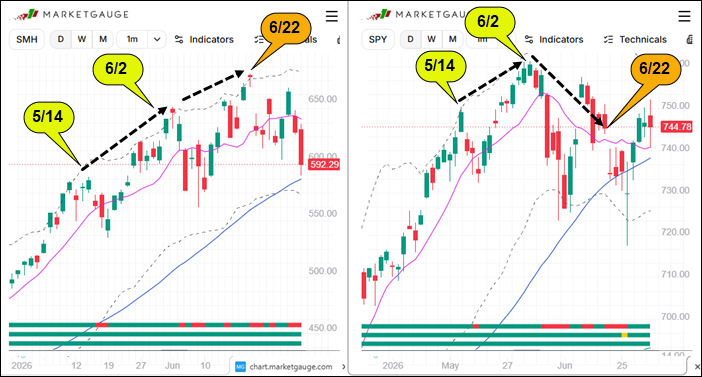
Not surprisingly, weakness in the SMH after June 22nd led to even more weakness in the SPY.
What Will Happen To The Market If Tech Cracks, Corrects or Crashes?
It’s no secret that tech is a high percentage of the cap-weighted SPY and QQQ indexes.
In fact, the Technology and Communications Services sectors combined account for roughly 48% of SPY and 65% of QQQ.
If SPY and QQQ define your market, then technology is your market.
Nonetheless, while tech will heavily influence the trend of these indexes, there are a few ways to determine:
It’s Time to Watch Capitalization and Correlation
When investors look for the market to “broaden out,” they’re really looking for a market that doesn’t have all its eggs in one basket.
It’s important.
The question is: How are you defining those baskets?
There are two obvious baskets that remain bullish right now.
Sector Rotation
As you can see from the sector summary table below, which is sorted by distance from the 52-week high (highlighted in orange), there are a handful of sectors near 52-week highs, while the XLK and SMH sit near the bottom of the list and are roughly 10% below their highs.
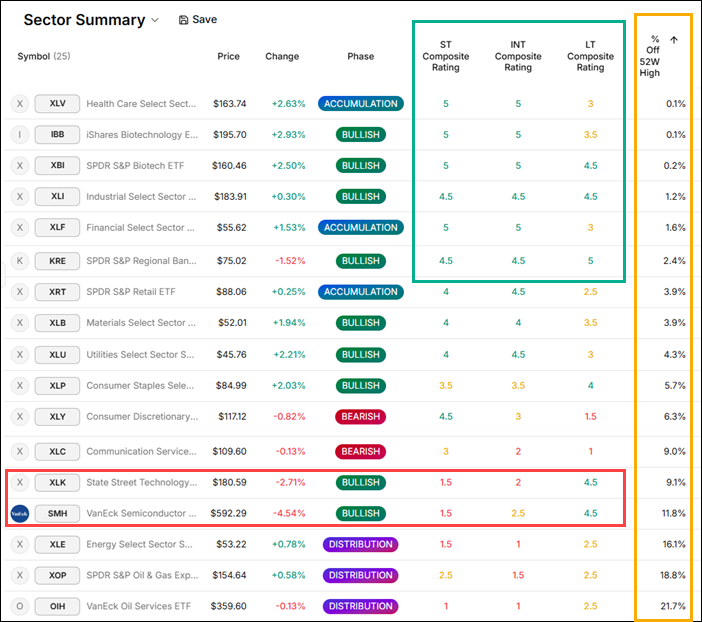
Additionally, you can see in the green box that the Trend Ratings for the top sectors are strong while the short and intermediate term ratings for XLK and SMH are weak. This is not always the case.
The table suggests money isn't leaving the market, it's rotating within it.
Market Capitalization
An easy way to objectively assess how the market is being driven by large-cap stocks is to follow the equal-weight ETFs for the S&P 500 (RSP) and QQQ (QQQE).
As you can see in the table below, the RSP has traded higher since June 2nd (the date of the SPY high), while the SPY has dropped by 1.7%.
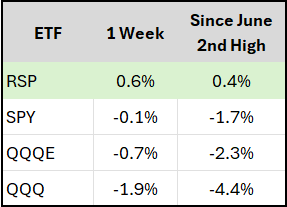
QQQE hasn't made a new high, but it has significantly outperformed the cap-weighted QQQ.
The Hidden Benefit of Equal-Weight RSP
One of the added benefits of following RSP is that, as a result of adjusting the capitalization weights, the sector influences change substantially.
As you can see in the table below, the equal-weight indexes have different sector weights. These are more pronounced in the RSP.
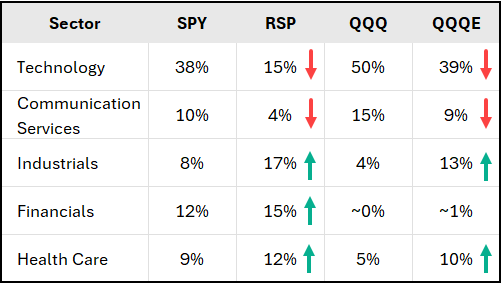
As a result of the sector-weighting changes, monitoring the RSP's performance relative to the SPY also provides insight into sector rotation.
If the SPY is being dragged down by tech and RSP is rallying,
then the market is not only holding up, it's rotating in a bullish way!
When Markets Get Ugly, Correlations Go To 1
For many investors, risk management is synonymous with asset allocation or diversification. Over the very long-term that may work, but in the short and intermediate terms it’s less reliable.
Recent markets, and especially with respect to stock-based sectors, have demonstrated that during substantial bear markets diversification doesn’t help – everything goes down, including the “defensive sectors.” In other words, sector correlations go to 1.
The positive side of this market trend is that, for the tactical trader, changes in correlations serve as a signal.
Why You May Wish For Tech To Sell Off Now
The Lag 7 aren’t your friend anymore; semiconductors are weakening, and the SPY is threatening to break the important 50-day support level.
The media will present this as bad news as the “market” goes down.
In some environments, and when you limit your definition to the market as “SPY”, it is bad news. However, right now, after a historic rally in semiconductors and other tech-related areas of the market, a consolidation phase would be healthy, and the SPY is not the only market.
Ironically, the healthiest outcome right now may be for technology to continue consolidating while money rotates into financials, healthcare, industrials and other leadership groups. In that environment, SPY and QQQ will struggle because of their capitalization weights, while the broader market remains healthy.
As long as the money flows from tech to other growth-related sectors (i.e. financials, healthcare, industrials, etc.) then the more balance market (RSP) can remain strong and provide a place to hide and wait until the high beta tech sectors is ready to run again.
There will be another bear market, catastrophic market crash, and economic recession, but we’re not there now.
If you listen to the market narrative and relate it to the right indicators and markets like RSP, you’ll see the danger coming with plenty of time to adjust.
If you'd like access to the MarketGauge indicators, strategies, automated trading models, and more, contact us.
Best wishes for your trading,
Geoff Bysshe
Co-Founder
(Connect on LinkedIn)
 |
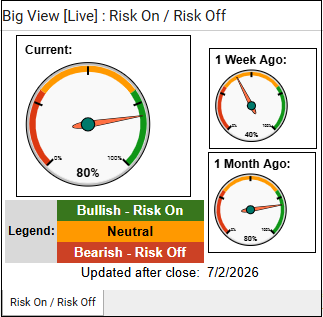 Every week we review the big picture of the market's technical condition as seen through the lens of our Big View data charts. Every week we review the big picture of the market's technical condition as seen through the lens of our Big View data charts.
The bullets provide a quick summary organized by conditions we see as being risk-on, risk-off, or neutral. The video analysis dives deeper. |
Summary: Markets continue to lean risk-on despite mixed index performance, as improving market breadth, stronger risk gauges, subdued volatility, healthy leadership rotation beyond semiconductors, and favorable seasonality outweigh the importance of the SPY and QQQ testing their 50-day moving averages. The primary uptrend remains intact as long as growth holds above its 200-day moving average, though weak volume, continued bond weakness, and the potential for semiconductor selling to spread more broadly remain the key risks to monitor.
Risk On
Neutral
Risk-off
(this is in the Premium membership)

Every week you'll gain actionable insight with: