June 7, 2026
Weekly Market Outlook
By Geoff Bysshe

When a market has a big short-term move, there is rarely just one cause.
However, the market and the media will almost always gravitate toward an explanation that assigns all the credit or blame to a single reason. It’s important to separate bullish and bearish factors from catalysts to figure out what’s next.
Friday’s catalyst was the employment report, but, as with most volatile, directional days, the magnitude of the move is attributable more to several factors that fueled it.
If you’re a regular reader of this column, it should not come as a surprise that today we’ll lay out the framework that highlighted Friday as a high-risk day. The stage was set for a slide before the labor report, and our live-in-the-market discretionary trading group heard a Friday morning message of, “The SPY could be down 2% today if it starts to slide, so let it fall.”
The reason to be bearish on Friday wasn’t the employment report. That was just the “last straw” that spooked the market’s momentum traders, who were playing a high-stakes game of chicken with each other in which they knew that if the market sold off quickly, there would not be time for everyone to lock in profits at the best prices.
Meanwhile, the momentum of the up move was such that selling a position one or two days early in the right stock could mean missing additional double-digit gains.
Additionally, several conditions are developing that could easily prolong any decline once it begins.
The market’s message from Friday is that a significant threat to the 2026 bull market just began, and it isn’t the labor market.
One simple signal of trouble is the weekly key reversal pattern in both the SPY and QQQ, as shown in the charts below. The market made a new high in the move and closed below the prior week's low.
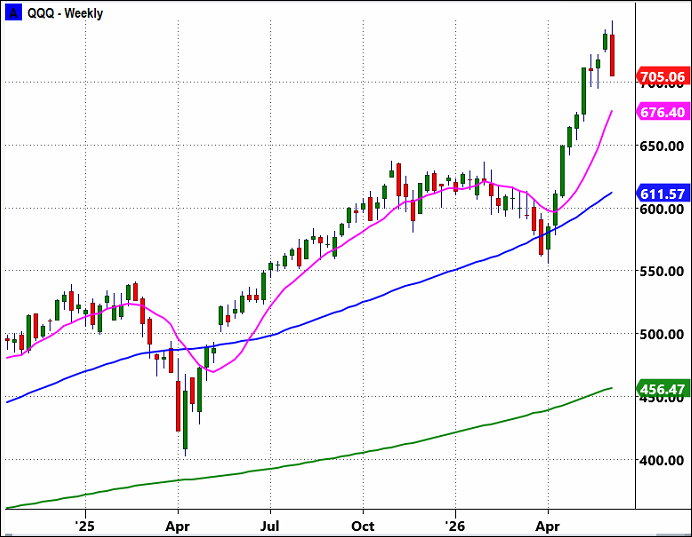
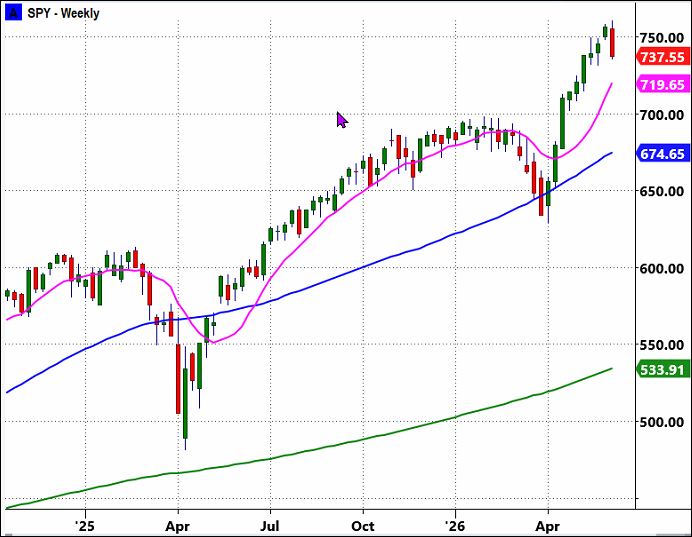
The key reversal is a bearish pattern, and if it follows through in the coming week, it will signal a shift toward a more cautious or even bearish trading environment until price action suggests that the reasons for the more cautious or even bearish sentiment have abated.
**The remainder of the post will be published later this evening. Please review the Big View section and Keith’s video below.
 |
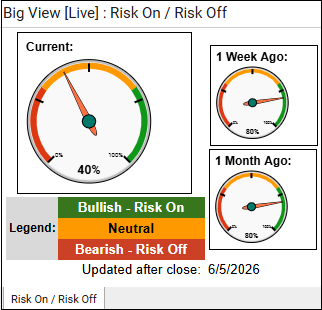 Every week we review the big picture of the market's technical condition as seen through the lens of our Big View data charts. Every week we review the big picture of the market's technical condition as seen through the lens of our Big View data charts.
The bullets provide a quick summary organized by conditions we see as being risk-on, risk-off, or neutral. The video analysis dives deeper. |
Summary: Markets experienced a sharp risk-off shift following a stronger-than-expected jobs report, with the Nasdaq suffering its worst week since March 2025, volatility spiking, market internals weakening, and key breadth indicators deteriorating, although major indexes remain above important support levels and longer-term trend readings are still positive. Despite the short-term weakness, healthy sector rotation, constructive readings from the S&P color charts, strength in parts of the modern family, easing inflation pressures from falling commodity prices, and favorable seasonal trends suggest the broader bull market remains intact unless support near the 50-day moving average fails.
Risk On
Neutral
Risk Off
Bullish Scenario (Most Likely)
Action:
If SPY closes decisively below the 50-Day Moving Average
The recent deterioration in new highs/new lows, market internals, and volatility is significant enough that it should not be ignored.
Overweight / Favor
Market Weight
Underweight
Friday's selloff created the potential for:
Remain invested but less aggressive. The long-term trend remains positive, but the combination of weakening breadth, rising volatility, and the breakdown in the 52-week new high/new low data argues for protecting capital until the market proves it can hold the 50-day moving average and re-establish upside momentum.

Every week you'll gain actionable insight with:


