August 9, 2026
Weekly Market Outlook
By Geoff Bysshe

Last week was filled with significant information in earnings, investor sentiment, inflation, interest rates, economic growth, geopolitics, and important technical milestones. However, often times, it’s what doesn’t happen that matters more than what does.
Weekly Market Outlook — Key Takeaways
One of the reasons markets can be counterintuitive, and as a result make sense to some while confusing so many others, is that price action is a function of several very different factors.
Furthermore, the significance of each factor is more often a function of its relative weight or change than an absolute number.
More simply put — in the markets, everything is relative.
Last week was filled with potentially confusing, but also very telling, statements about investor sentiment and what may drive the direction of the stock market in the coming months.
For example...
Friday’s labor report was surprisingly weak, yet the long bonds didn’t react by pushing rates lower, or bond prices higher, as one might logically expect.
In the prior week, the bond market had been signaling concern that the Fed should raise rates.
The Fed pushed back at its FOMC meeting by suggesting that it wasn't close to raising rates.
Now, weaker-than-expected labor market data reduces the pressure to raise rates and adds to the shift in sentiment that has been developing over the last two weeks — from concern about a hawkish Fed to expectations that the Fed can remain on hold.
If you’re a stock investor, you like lower rates and a Fed that is not anxious to raise them.
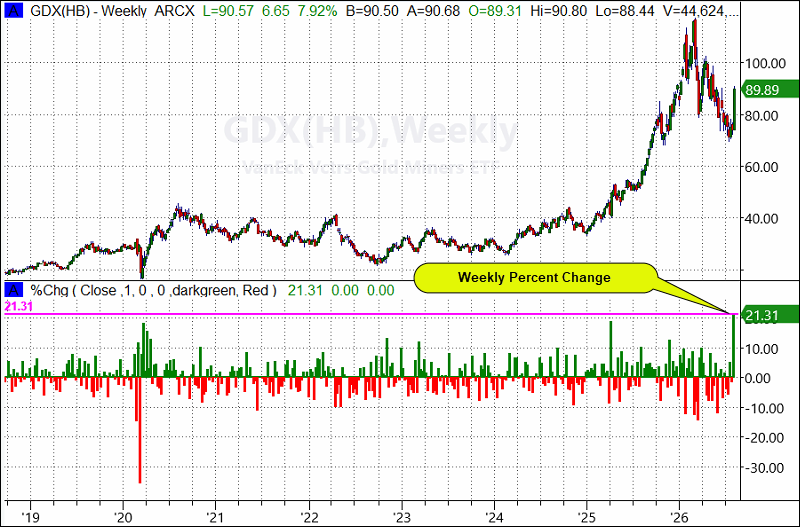
If you’re a gold investor who believes the Fed won’t be aggressive in fighting inflation by raising rates, then higher inflation, stable long-term bonds, and a Fed on hold is music to your ears.
Often times, it’s what doesn’t happen that matters more than what does.
Last week gave us another excellent example.
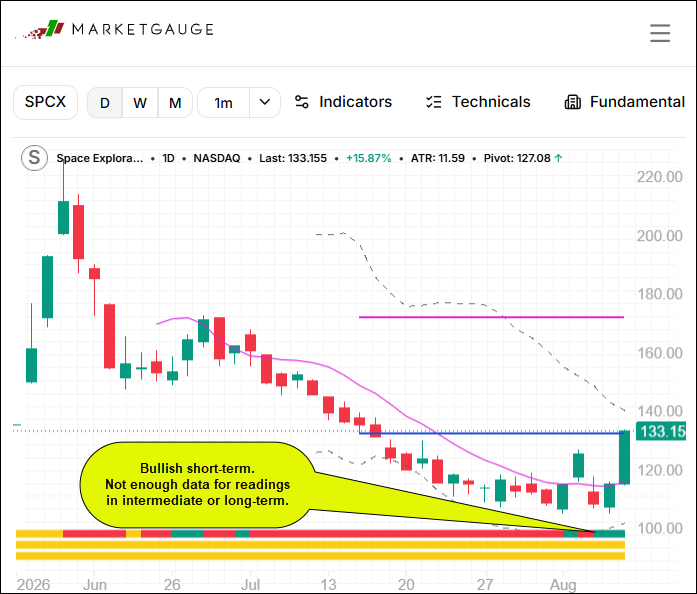
SpaceX reported earnings Tuesday after the close. Its losses were less than expected, but capital expenditures were higher than expected.
Increased capex combined with negative free cash flow has been some of the worst news a growth company could give investors recently.
SPCX fell only modestly the next day, then rallied Thursday.
The pattern created a nice double bottom, but earnings weren’t what SPCX bulls feared most.
They feared the unlocking of more than 900 million shares held by pre-IPO owners.
That represents an enormous amount of potential selling.
On Friday, the first big unlock occurred.
The stock rallied 15%.
Where is all the feared insider selling?
This is the same idea as "sell the rumor, buy the news", but better because no news is good news here.
If this lack of selling holds next week, this is a big buy signal based on a shift in investor sentiment on top of an earnings report that received a bearish response that didn’t follow through to the downside, then reversed higher.
If this buy pattern is good, SPCX should not trade under Friday’s low and certainly not below the all-time high low.
Investors looking for a pullback from the IPO got their 50% correction from its high. Look for the bottom to confirm next week.
**The rest of the commentary will be released tonight.
 |
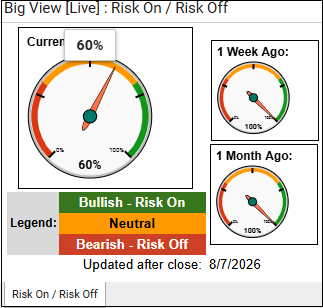 Every week we review the big picture of the market's technical condition as seen through the lens of our Big View data charts. Every week we review the big picture of the market's technical condition as seen through the lens of our Big View data charts.
The bullets provide a quick summary organized by conditions we see as being risk-on, risk-off, or neutral. The video analysis dives deeper. |
Summary: U.S. equities strengthened meaningfully over the past two weeks, with the S&P 500 reaching a new all-time high as improving volume, broad sector participation, low volatility, renewed growth leadership, and favorable seasonality reinforce the risk-on backdrop despite elevated geopolitical risks. However, market internals and risk gauges continue to lag price action, while surging gold, a weaker dollar, pressure in emerging markets, and falling long-term bonds suggest some underlying caution amid the uncertain geopolitical environment.
Risk On
Neutral
Maintain a risk-on bias and favor equities while the major indexes remain in bullish phases, with the S&P 500 at new highs, volatility subdued, and seasonal trends providing a tailwind through mid-to-late August. Favor growth and offensive sectors, particularly technology and biotech, while maintaining exposure to other areas showing healthy bull phases; continue to monitor semiconductors as a potential weak link.
Look to add exposure on orderly pullbacks rather than chase strength after the market’s sharp two-week advance. Use the 50-day moving averages and recent swing lows as key risk levels, particularly in growth stocks, where a VUG break below last Monday’s low and its 50-day moving average would warrant reducing exposure.
Keep some dry powder and defensive diversification given the disconnect between strong index prices and less-convincing market internals and risk gauges. Gold’s breakout, dollar weakness, declining long-term bonds, and elevated geopolitical uncertainty suggest maintaining some exposure to precious metals while being prepared for volatility to return quickly.
Overall, stay invested but remain tactical: press the long side while breadth, volume, volatility, and market phases continue to confirm the advance, but avoid becoming fully complacent at new highs. A deterioration in internals, renewed distribution, a volatility breakout, or major indexes losing their 50-day moving averages would be signals to reduce risk and raise cash.

Every week you'll gain actionable insight with: