July 26, 2026
Weekly Market Outlook
By Geoff Bysshe

Three trends are going to shape the rest of the year.
Corporate earnings and enthusiasm over AI have enabled the bull market to overcome several serious threats.
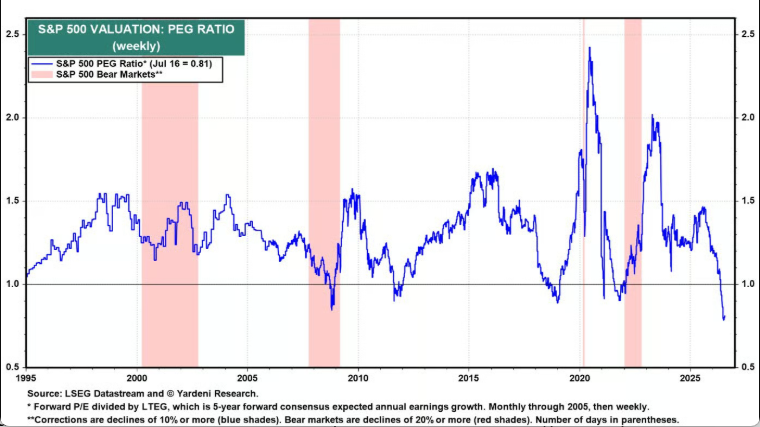
Now, one of the market’s most widely followed valuation measures, the PEG Ratio, is more bullish than it has been in 30 years.
Yet retail investors are selling, major indexes have fallen below important support, and strong technology earnings are being met with weakness.
If growth is improving and valuations are attractive, why aren’t investors buying?
A low PEG Ratio indicates that stock prices are relatively low compared with expected earnings growth.
As you can see from the chart below, the current level of the PEG Ratio is usually associated with the beginning or accelerating bull markets (i.e. 2009, 2011, 1998, 2021).
As we’ve said for a long time in this article, the extraordinary trend in corporate earnings has justified the impressive strength in the bull market in recent years.
As we enter the current earnings season, the growth expectations reported by FactSet in the chart below suggest things are only getting better.
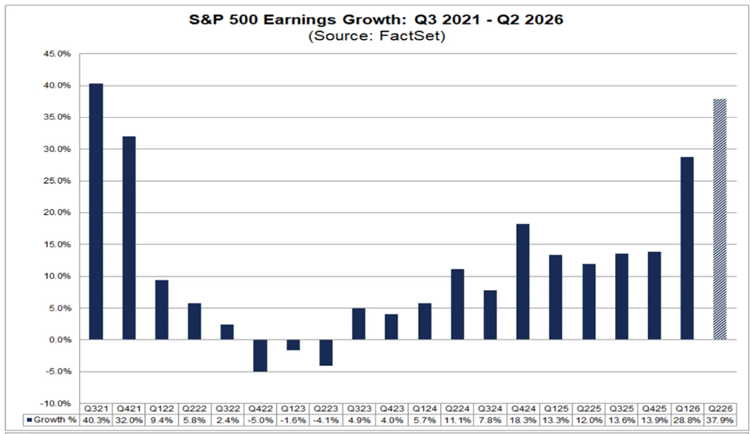
Based on earnings growth alone, the market appears capable of moving significantly higher.
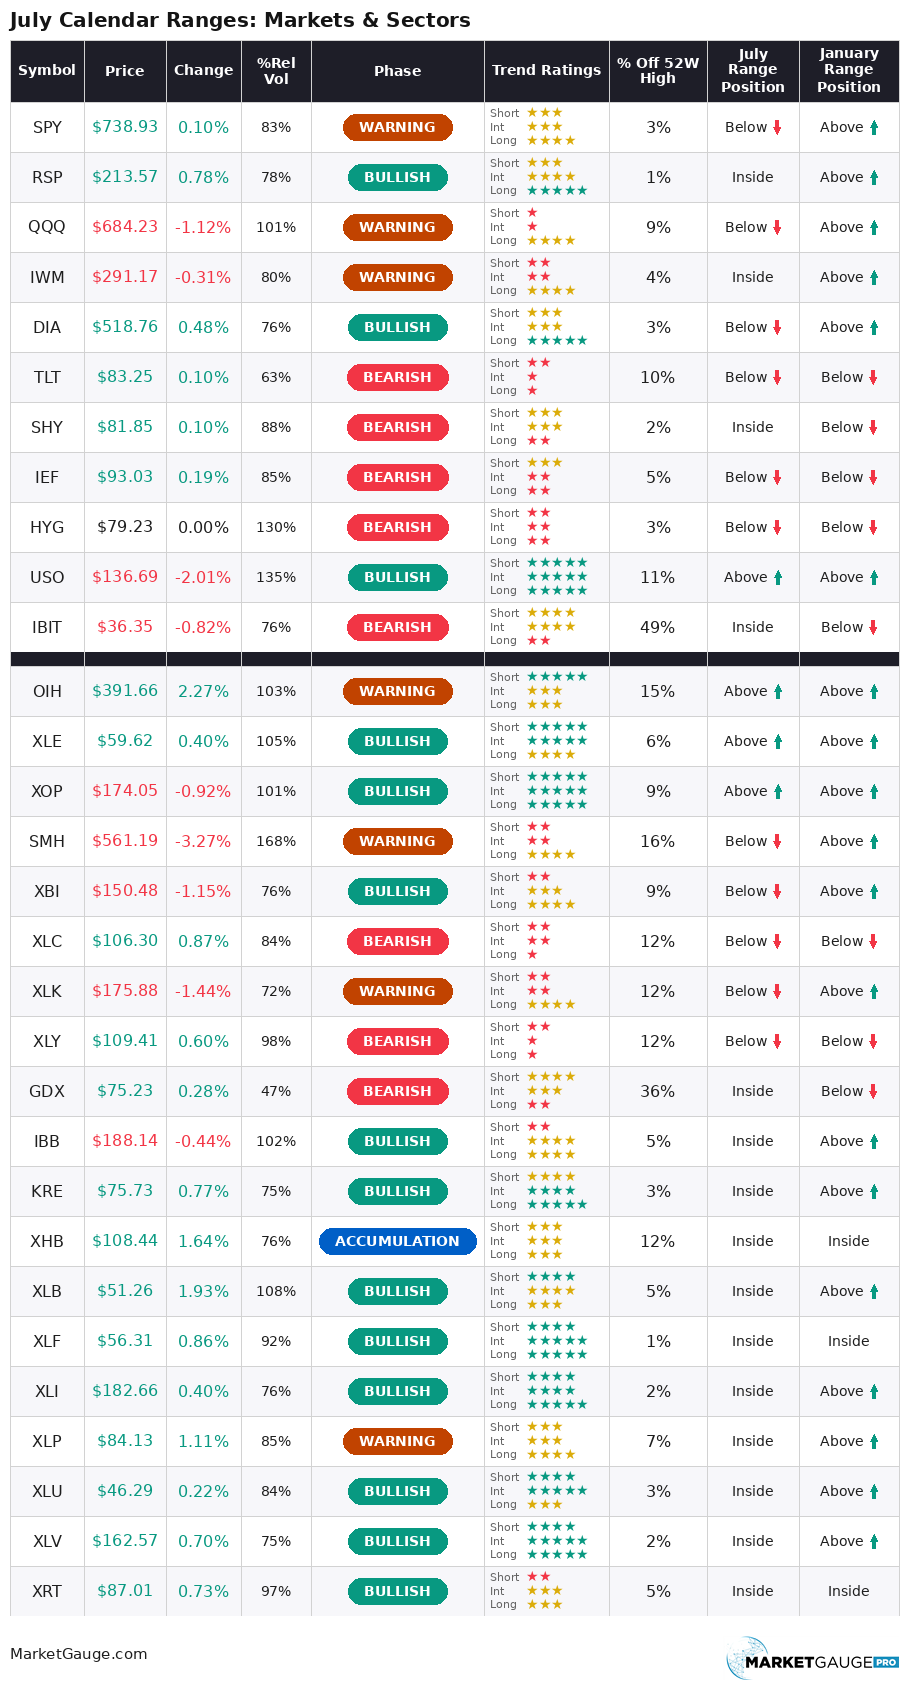
Price action is telling a different story. Last week, several widely watched warning signs emerged. SPY, QQQ, and IWM all moved into Warning Phases.
The Hidden Drag On The Market From The War
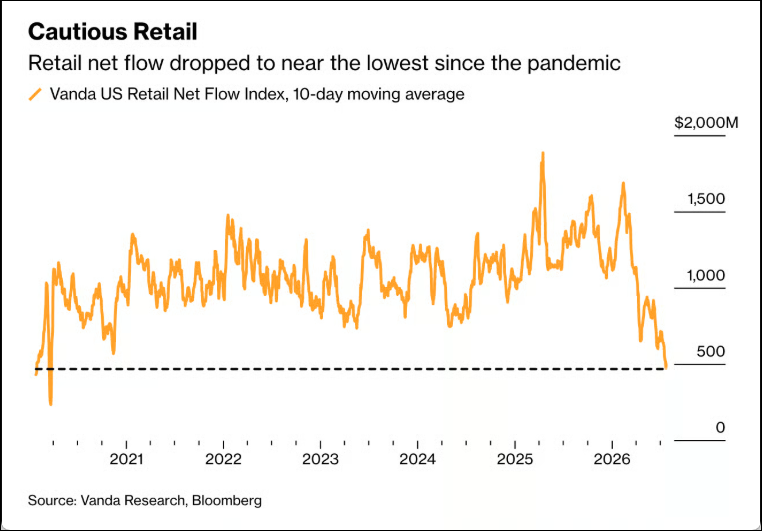
When the market corrected during Trump’s Liberation Day tariff announcement, retail investors stepped in and bought the dip while institutions anticipated larger drawdowns.
Retail investors also bought the December 2025 dip enthusiastically. However, when the war with Iran began, retail flows reversed. This is an important source of market demand.
As the chart below shows, they are still selling.
If growth is so strong and valuations are so low, why are investors selling markets down below their 50-day moving averages?
More importantly, should you expect more market declines ahead?
Simple Earnings and Interest Rates Analysis That Works
In last week’s Market Outlook, “An Extreme Energy Crack Spread...” (also on Seeking Alpha), we highlighted the importance of watching the market’s reaction to corporate earnings reports.
It is useful to understand why a stock falls after reporting better-than-expected earnings. However, the repeated pattern is more important than the explanation for any one company. When strong earnings consistently lead to lower prices, the bulls are no longer buying growth as aggressively as they once did.
Understanding one company’s reaction requires studying the details of its earnings report. When the same reaction occurs across multiple market leaders, however, you do not need to be an accountant to recognize that sentiment has shifted from “buy growth” to “sell the news.”
Last week, several important market leaders sold off after reporting better-than-expected earnings or growth, including GEV, GOOGL, INTC, TSM, and GE.
The “sell the news” cycle happens in every bull market, and sometimes more than once. It can be a healthy temporary digestion of enthusiasm or the canary in the coal mine indicator of the end of a bull market, but it alone won't answer that question.
For active tactical investors, this is not a condition to ignore. Near-term volatility should be expected, making this an appropriate time to consider hedging, rotating into stronger sectors, reducing weaker positions, or using a combination of all three.
The Change In Sentiment Is A Symptom, Not The Real Problem
Weak sentiment alone does not create a bear market. The larger risk is that inflation and rising interest rates eventually slow economic growth enough to create a recession.
Several forces are keeping inflation and long-term rates elevated:
However, you don’t need to be a Wall Street economist to see what matters.
In the chart below, you’ll see gray shaded areas that indicate the recent upswings in USO since the beginning of the war with Iran.
During the shaded periods, rising oil prices were accompanied by falling bond prices. When semiconductors followed bonds lower, broader stock market pressure increased.
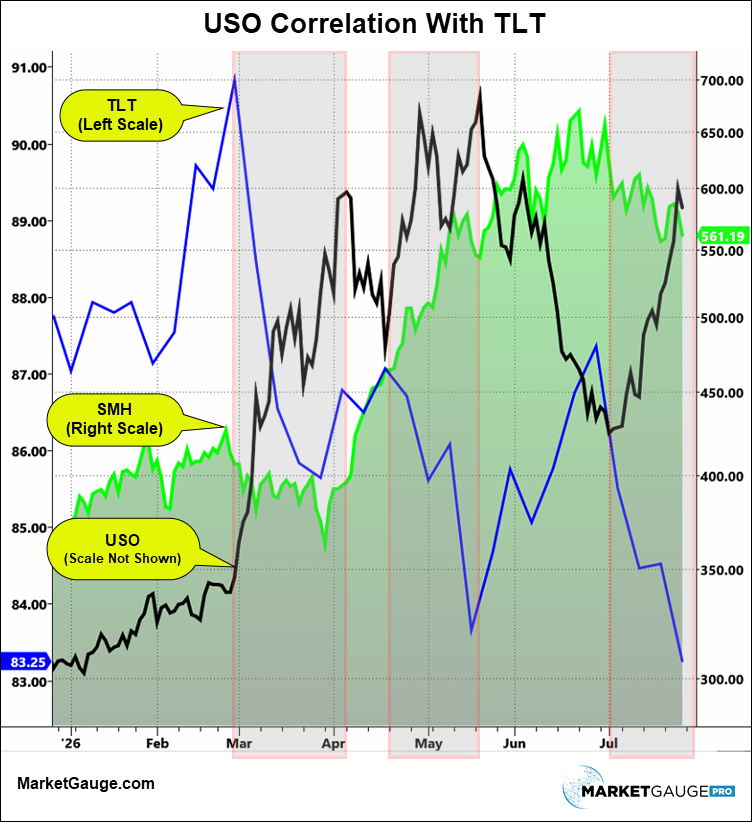
The market sees significant increases in the price of oil (USO) as inflationary, and the long end of the yield curve (TLT) is currently sensitive to inflation fears. As big-cap tech stocks increase their debt and reduce their free cash flow, investors have understandably become more sensitive to higher rates.
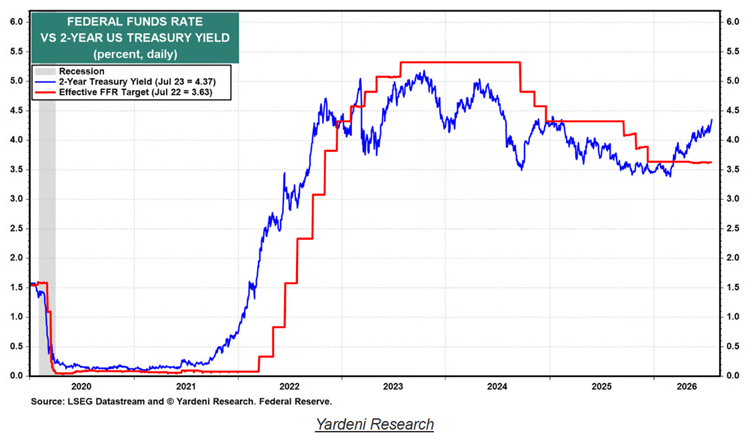
It’s not just the long end of the yield curve that’s pointing to higher rates ahead.
The two-year Treasury yield has historically tended to lead changes in the Fed Funds rate. Based on the current gap, the market appears to be signaling that the Fed Funds rate may need to rise by the equivalent of approximately three quarter-point increases.
The New Fed’s Guidance Is Clear
Fed Chair Walsh appears aware of this dilemma and of the Fed’s ability to influence markets through its communication. Although he has pledged to provide less guidance, he has been deliberate in reinforcing the Fed’s commitment to reducing inflation.
In the final week before an FOMC meeting, Fed Funds futures have historically reflected more than an 80% probability of the expected outcome.
This time, the probability of a rate hike is only about 40%. That unusually divided outlook increases the likelihood of bond market volatility regardless of the Fed’s decision.
Given the stock market’s current sensitivity to downside bond volatility, we’ve been focusing on the areas of the market that are less likely to be negatively impacted by higher rates.
This rate-sensitive environment favors sectors whose earnings are less dependent on falling interest rates or aggressive growth expectations.
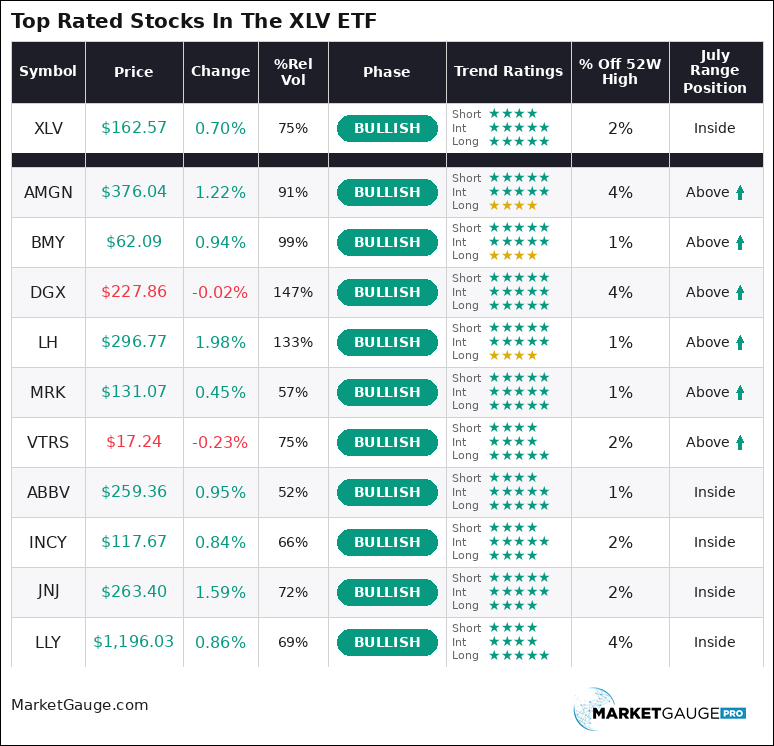
The market has already begun rotating in this direction. Healthcare and financials are among the highest-rated sectors in the summary table and remain close to their 52-week highs.
Below you’ll find tables of top PRIME-rated stocks from the XLV and XLF sector ETFs.
If you’re not familiar with MarketGauge’s PRIME methodology for analyzing stocks, you’ll find a description of it in prior articles like “4 of the 5 PRIME Trend Factors Are Bearish” (here on Seeking Alpha)
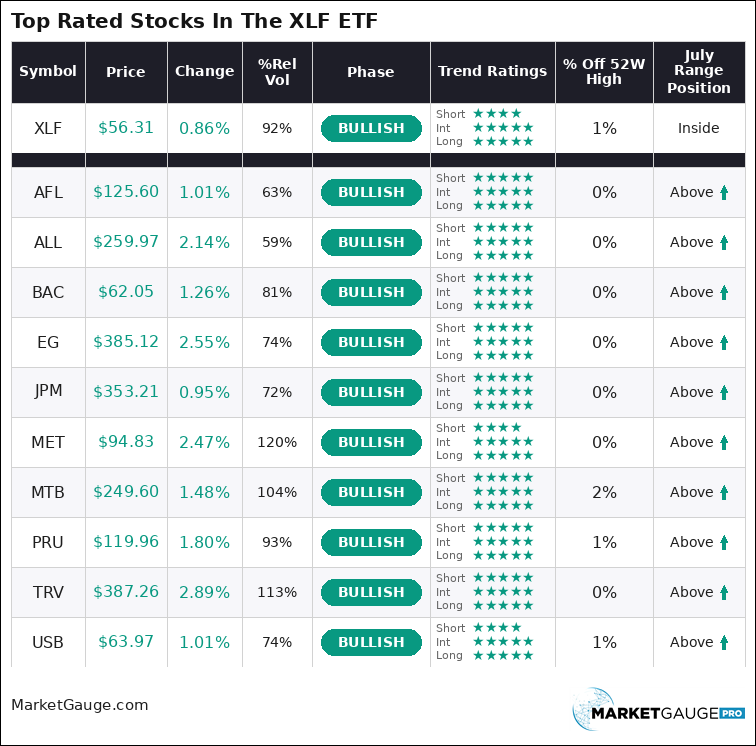
Note that all of the stocks above are over their July Calendar Range high, which is stronger than the XLF’s position inside its range.
Conclusion
Strong earnings growth and an unusually low PEG Ratio continue to support the long-term bull case. However, investors are currently responding more negatively to strong technology earnings, while rising oil prices and interest rates are creating pressure on bonds and growth stocks.
So far, rotation into energy, financials, industrials, transportation, and healthcare has prevented weakness in semiconductors from becoming a broader market breakdown. That rotation is the most important source of support for the market.
The risk of a deeper correction will increase if higher rates and weakening sentiment begin to pull these stronger sectors below their July Calendar Range lows.
For now, the simple tactical rule is to maintain a bullish bias toward stocks and sectors above their July Calendar Range lows and a bearish bias toward those below them
 |
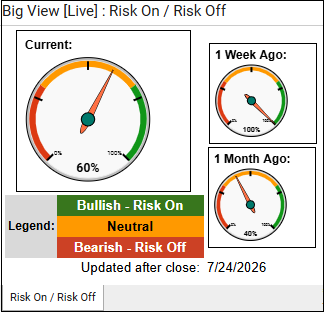 Every week we review the big picture of the market's technical condition as seen through the lens of our Big View data charts. Every week we review the big picture of the market's technical condition as seen through the lens of our Big View data charts.
The bullets provide a quick summary organized by conditions we see as being risk-on, risk-off, or neutral. The video analysis dives deeper. |
Summary: Longer-term market trends remain constructive, but the evidence continues to shift toward caution as momentum weakens, market internals deteriorate, and leadership rotates away from growth toward more defensive and inflation-sensitive areas. With broad sector weakness, rising commodity prices, elevated volatility, and seasonal headwinds, the market appears to be entering a more challenging near-term environment despite the longer-term bull trend remaining intact.
Risk On
Neutral
Risk-off
The longer-term trend remains constructive, but the weight of the evidence has shifted toward a more defensive near-term posture. Maintain core long exposure while reducing aggressive growth positions, tightening stops, and avoiding heavy new commitments until market internals and momentum begin to improve.
Watch for SPY and QQQ to reclaim their warning phases and for market breadth, volume, and the 52-week new high/new low ratio to stabilize before increasing risk. Until then, favor areas showing relative strength—such as value, energy, and selective defensive sectors—while monitoring commodities, Treasury yields, and inflation-sensitive assets for signs that inflationary pressures or geopolitical concerns are becoming a larger headwind for equities.
**There will not be a video this week

Every week you'll gain actionable insight with: