December 25, 2022
Weekly Market Outlook
By Keith Schneider

Gaugers, I hope you are having a good weekend celebrating the holiday. Once again, we extend our heartfelt wishes to you and your families for a healthy, happy, and peaceful holiday season.
There is so much to be negative about given the poor investment climate we have been experiencing most of 2022. However, instead of focusing on the continued negative state of the stock and bond markets, we thought we would spend time on some of the recent positives that have emerged as well as potential contrarian aspects of the markets that may deliver better investment cheer as we enter 2023.

Inflation Data is Starting to Show Signs of Slowing.
Friday afternoon the Fed’s favorite inflation indicator (the PCE-Personal Consumption Expenditures) came out for November and was slightly hotter than expected at 4.7% YoY versus 4.6%. However, what many missed (not the markets) is that 4.7% was less than the previous Fed’s December plan and what many believe was their expectations for their recent hawkish comments that accompanied a 50 bp raise two weeks ago. This is good news. See chart below:

There are signs of a fairly dramatic slowdown in Inflation.
Here is a chart of M2, the money supply, which has decreased significantly. This should have a positive effect on taking surplus money out of the Fed’s system:

Americans are beginning to curtail spending, something that the Fed would like to see more of:

-

-

-
And one of the most significant contributors to Inflation during this cycle has been wage growth:

If this continues, this will undoubtedly be helpful in getting the Fed to slow down their future (2023) Fed Fund rate hikes. However, we do not see them pivoting to rate cuts anytime soon, at least not in 2023.
Late December has been historically a positive period. January is typically good too.
Friday, December 23rd started this year’s Santa Claus Rally (SCR) which will last until January 4th, 2023. This period is positive 78% of the time. Yale Hirsch (famous for the Stock Trader’s Almanac which his son Jeff now runs) began this observation years ago. This summarizes it best:


January also has a higher % rate of positive returns as evidenced in this chart indicating that the best odds for a positive return is the 2nd half of December (78% positive) followed by a 62% positive period during the first half of January:

The NASDAQ (tech stocks) had a brutal 2022 return, down so far 32.8%. There is a 50/50 chance that the NASDAQ is positive in 2023:

At MarketGauge we like to say that there is always a bull market somewhere.
As many of you are aware, we have several investment strategies that have produced positive returns this year and over longer term time frames. Our quant, algo based decision models caught several emerging trends throughout the year which included: energy, oil company stocks, alternative energy, commodities, mining, and metals, rising interest rates, and other stocks and ETFs. You may be surprised to know right now there are 4 strong areas of the market that are above their 200-DMA. They include XLE (Energy), XLV (Health Care), XLP (Consumer Staples) and XLI (Industrials), and one of the positions in a MarketGauge strategy right now. See the chart below:

Referring to XLV, it finally made a new recent relative high and may be about to have a new breakout (and may be a positive area for investors as we head into 2023).

The US Dollar peaked on September 26th. Since then, it has declined by approximately 10%. Several sectors of the market have had good results. If you followed MarketGauge strategies, you would have been in several of these:

A closeup shows the actual % returns of these areas:

Bearish indicators are starting to drag on longer than typically expected:
With yet another week of bears outnumbering bulls, the record streak of negative readings in the bull-bear spread has grown to 38 weeks long; a full month longer than the previous record ending in October 2020. Historically, investor sentiment has acted as a contrarian indicator meaning low readings on optimism have typically been followed by stronger returns for the S&P 500.


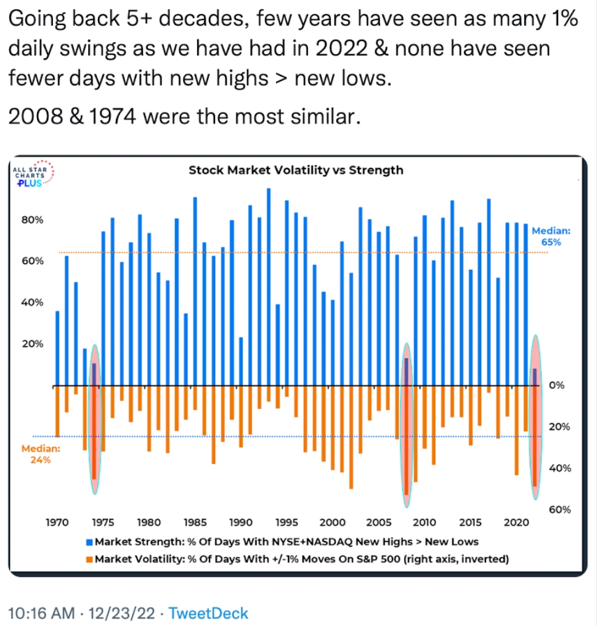
Enhanced volatility usually is lessened during the second year of a bear market. Notice the below chart showing 2022 having similar volatility as 1974 and 2008. Notice the strength (new highs > new lows) the following year. Our hope for 2023.
The traditional 60 (stocks) to 40 (bonds) portfolio was a big loser in 2022. It should perform much better going into 2023. Bad 60/40 years are typically followed by positive ones (note 2009). See chart below:

The Mega Cap stocks are starting to become value stocks. (this commentary does not imply they cannot or will not go down further, but they are sitting at more attractive valuations)

Here are some additional observations from Big View:
Risk On
Neutral
Risk Off

Every week you'll gain actionable insight with:


