July 10, 2022
Weekly Market Outlook
By Keith Schneider

Are we in a recession? If not, when will we be?
Is it the right time to go back into the stock market? Have interest rates stopped increasing for now?
Will my food costs continue to climb?
These are just a few frightening questions confronting Americans and investors today.
The leading economic indicators are all over the place.
Daily, forecasters claim that we have probably started a recession (NOT) and that Energy prices will continue to climb (while they’ve declined over 10% in the past few weeks).
What to make of all the noise? There are a host of different and conflicting narratives playing out through the media, economic publications, newsletters, talking heads, and stock market pundits?
After two weeks of a market rebound and a rally in the fixed income markets, we have kicked off the mid-year start in a more positive, more profitable way.
This shouldn’t surprise followers of our January and July seasonal (or Calendar) range indicators.
Is the selling over?
Is it safe to go back into the stock and bond markets? Is there a real and sustainable pause regarding food and commodity prices?
The answer is unequivocally, NOBODY KNOWS.
More importantly, the markets are acting in a quick, volatile, and anticipatory manner considering the fact that markets are a discounting mechanism that looks 6 to12 months into the future.
As a result, good news is bad news and vice versa.
This is normal in a changing economic environment with a non-accommodative Federal Reserve. Expect the unexpected.
However, we DO NOT think the stock market has reversed modes and is now, all of a sudden, in a new bull market.
Corrective rallies like the current run-up happen often and quickly in bear markets.
So heed caution.
Rallies like this one can and will turn on a dime.
Until there is clarity in the future economic forecasts, stock market rallies are suspect, and there are still plenty of economic clouds on the horizon.
Fixed income securities ended the week with a reversal. The decline in interest rates over the past few weeks turned around and headed higher.
This was prompted by a better-than-expected jobs report on Friday morning indicating that employers are still hiring in large numbers. The market’s tick-up in long-term rates supports our feeling that if we were already in a recession or about to begin one, we would NOT have seen such a big increase in the payrolls number.
Although unemployment (and first-time claims) is a lagging indicator, we do not believe employers would be hiring at this fast pace if they believed that economic conditions were in or about to decline. Employers also understand the worker shortage and cannot afford to let more job openings occur.
Examining the employment situation more deeply.
It’s important to look at facts and data more closely.
The establishment survey came in with new employment at 372,000. This was 100,000 over the estimates of 268,000. At first, the market did not like this hot number, and markets indicated that the Fed would continue to be aggressive and that a 75 bp rise was baked in the cake. See the steady employment picture below:

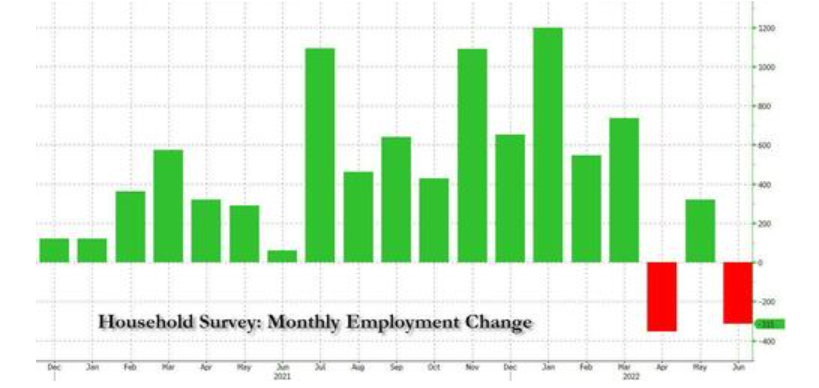
But upon further review, the Household survey (monitors who is working and the hours they are putting in) showed a considerable decline in employment from April to June with the latest month showing a drop of 315,000 workers.
This Household data propped up the market on Friday and began the narrative that perhaps the slowdown is happening, and that the Fed needs only raise 50 basis points in July. (See household employment graph below)
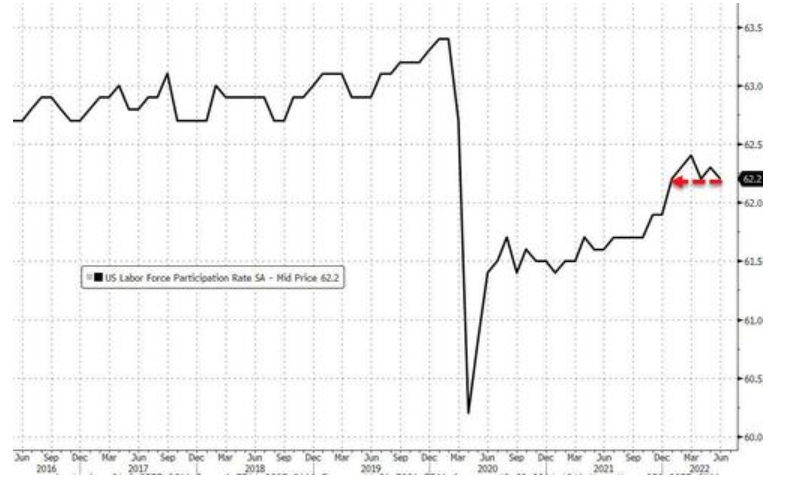
The household survey includes a closer look at the labor participation rate (LPR is how many people are working) and clearly showed that new job creation was heavily driven by people who are taking a 2nd or 3rd job. (For example, someone who may take a second part-time retail job, or someone who drives an UBER after their normal working hours). This is more evident in the LPR graph below which shows NO ADDITIONAL people are entering the workforce.
The conclusion to draw is that we ARE seeing a slowdown in the economy already.
The stock market is a forward-looking indicator, and the brutal selloff from April to June (2nd quarter) anticipated much of the data that’s now coming to light.
While consumer spending has also waned in recent weeks, (along with retail sales turning soft) certain parts of the economy are still doing quite well.
For example, oil companies, along with energy supply companies, continue to be the bright industry sector in 2022, mainly due to higher commodity prices,
After a brutal selloff these past few months, this week’s rally in technology and semiconductor stocks conveys strength in specific industries which had gotten quite cheap during the 2nd quarter’s market selloff.
At the end of the day, a stock’s valuation (and the general market’s valuation) is made up of several components, inflation, interest rates, and earnings (expectations).
Let’s examine each briefly:
#1. Inflation is currently elevated but appears to be coming down even slightly.
#2, After spiking earlier in the Spring, interest rates too have come down and leveled off suggesting a slowdown in the economy.
#3. Earnings, one of the most important indicators, continue to hold steady. Estimates from Wall Street analysts see corporate earnings growth of somewhere between 4-5% this quarter. That is not indicative that a recession has begun. (These estimates are showing 15%-18% over the next 12 months, a far cry from recessionary periods).
However, if earnings expectations begin to be ratcheted down to adjust for higher costs and an expected slowdown in business, it will soon be reflected in earnings announcements and conference calls.
Stay tuned-in, as earnings season begins in earnest with JP Morgan’s earnings announcement this coming week.
So, we have a mixed bag. One that may surprise those expecting the worst or best of times.
The strength of the jobs report may well have solidified the next move by the Federal Reserve to hike 75 bp again at their upcoming July meeting. The futures market has it priced in at a 97% probability.
Certainly, we should expect that the Fed will continue to raise interest rates as they’ve suggested.
So, if you’re a believer in the mantra of “don’t fight the Fed,” then this may create a dilemma for your stock market allocation.
MarketGauge doesn’t fight the Fed because there are many trends that do well when the Fed needs to tighten. We follow them.
Five Indicators to Watch for Signs of When it is Safer to Invest
We have continually stated over and over (since last November), it is time to be cautious, and here’s how…
Watch our Gauges, read the Big View commentary below, sign up for Mish’s daily updates and become a subscriber of several of our investment strategies.
The easiest way to move forward with your trading is to book a call with our Chief Strategy Officer, Rob Quinn, who will give you a free and objective one-on-one assessment of how you’re trading and whether or not MarketGauge can help you.
Click here to book a consultation call, and immediately after the call, you’ll feel a lot more confident about your trading decisions
Risk-On
Risk-Off
Neutral

Every week you'll gain actionable insight with:


