October 11, 2026
Weekly Market Outlook
By Geoff Bysshe

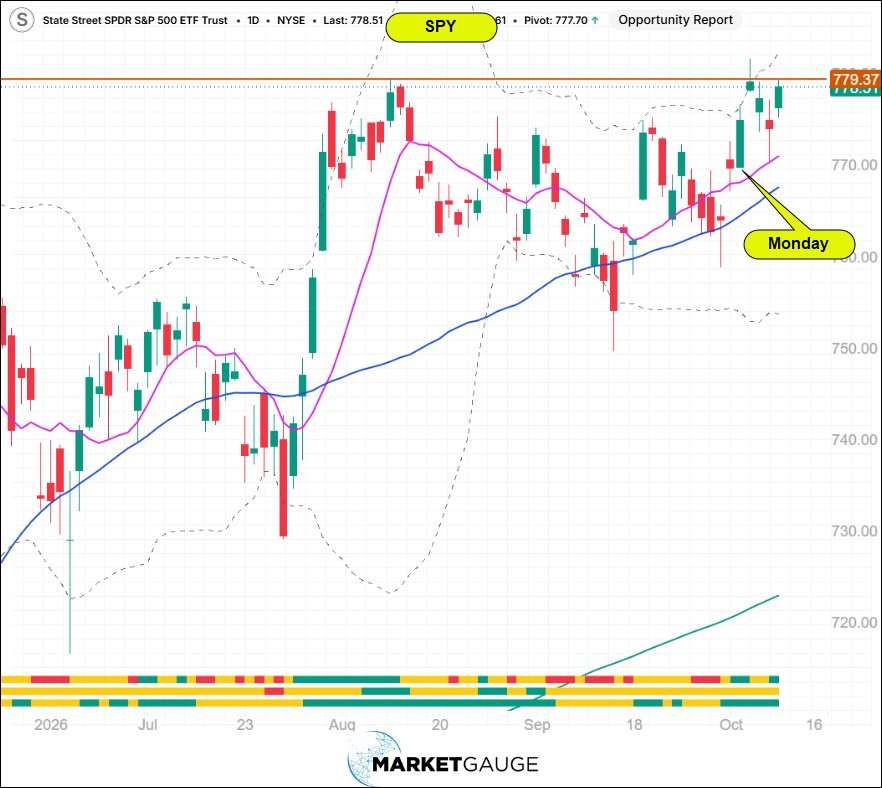
Last week, stocks (SPY) got off to the bullish start we were looking for, but then the roller coaster of news events took over.
Click here for the live SPY chart
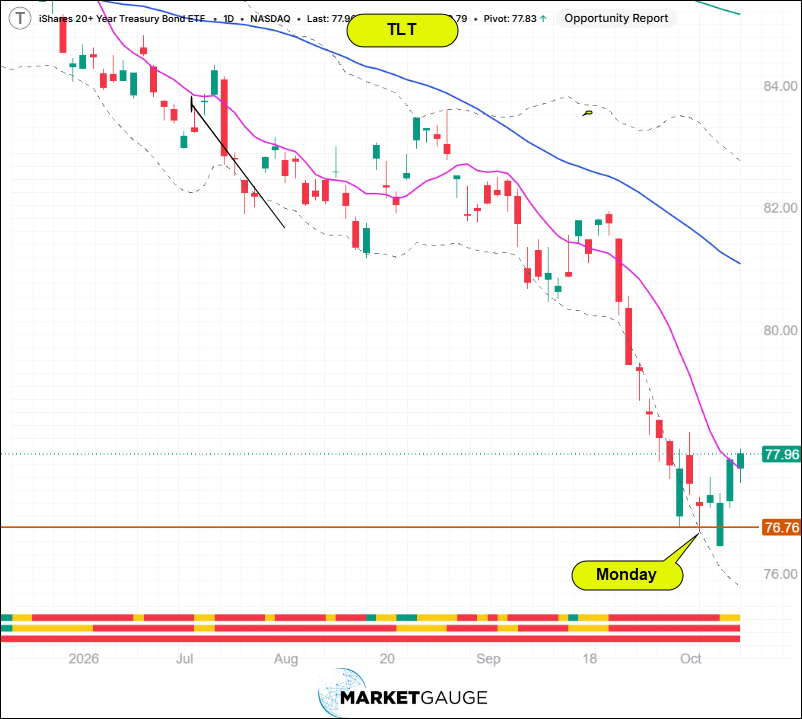
The most impressive part of stocks’ Monday and Tuesday (above) was that it flew in the face of surging Treasury yields (falling TLT – below).
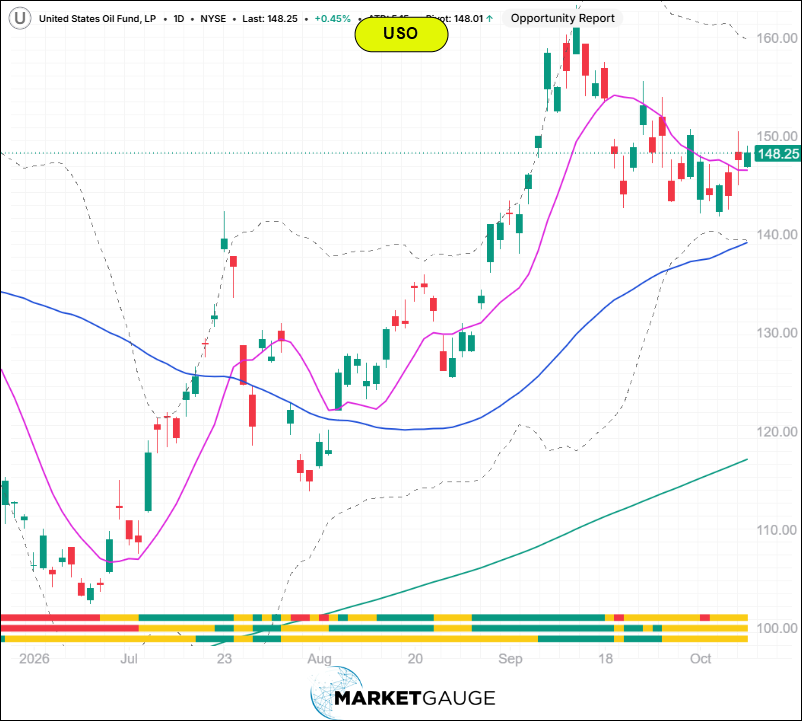
The bulls were helped by moderating oil prices on Monday and into Tuesday’s open (below).
Click here for the USO chart live
However, on Wednesday, hawkish Fed minutes revealed that most officials expect another rate hike this year as inflation remains stubbornly high.
Thursday, a Financial Times report questioning OpenAI's revenue outlook rattled semiconductor stocks. This, along with another oil spike, sent stocks lower.
Then Trump stepped in and announced productive talks with Iran and pledged no military strikes before the November elections, sending oil prices lower late Thursday.
Finally, Friday brought another twist as Trump announced a Russian diesel supply agreement.
For many investors, it probably looked like the same old story - oil was shaking up stocks and bonds, and Trump was doing his best to stoke the bullish narrative for stocks with news to push oil and diesel prices lower.
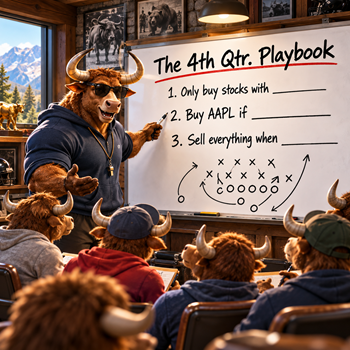
But last week’s Market Outlook suggested you focus on three questions to avoid getting swept up in the news flow.
The Important Moves
Last week was threatening for the SPY and QQQ, but both still have very bullish charts if they break higher. “If”.
The big news for the bulls was in bonds. You need only to look at the big green candles from last week, one from a new low for the move to see that there was something different about last week.
The big news, however, wasn’t the green candles, but rather the fact that both the 10-year and 30-year bond auctions were very well received on Wednesday and Thursday, and the TLT market responded with big rallies both days.
A strong bond auction won’t calm the media's focus on headline inflation, but more importantly, it showed demand for US bonds from foreign and domestic investors.
If bonds can find a level of support here, stocks have a good chance of moving higher, assuming earnings season doesn’t create new problems
The Broad Market Finds A Bottom
The table below shows the ranking of the key markets by WTD performance. RSP tops the list. It’s not a raging bull indicator, but it’s the market rotation investors want to see when SMH is getting hit, and SPY is pulling back
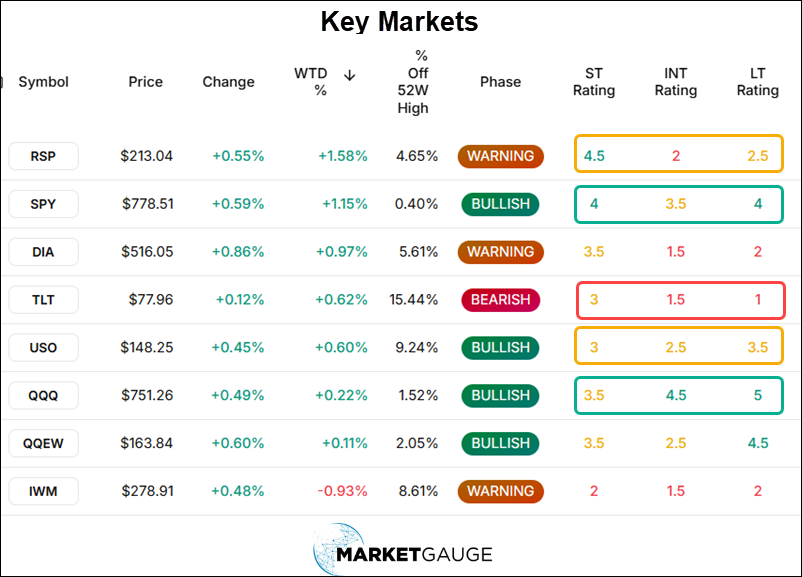
In the table above, I highlighted the short-, intermediate-, and long-term ratings with colors that represent how I’d rate their total score. The best news, perhaps, is USO as neutral. The chart of USO could go either way, but neutral suggests it may struggle if it heads higher. Let’s hope that’s the case.
Next Week: The News Changes
Next week, earnings season kicks off with the banks. While earnings are the key driver of this market, the key indicators are still the same 3 questions posed above.
We’ll also get inflation data, but how much that matters will be answered by the same questions – do the bonds maintain a bottom here?
The news will change, that narrative hasn’t, and your focus shouldn’t either.
Want More MarketGauge?
If you’re an individual investor or an advisor, and would like help navigating the ever-changing dominant themes in the market with strategies, tools, automated trading systems or professional advisory services, contact us:
Best wishes for your trading,
Geoff Bysshe
Co-Founder
(Connect on LinkedIn)
 |
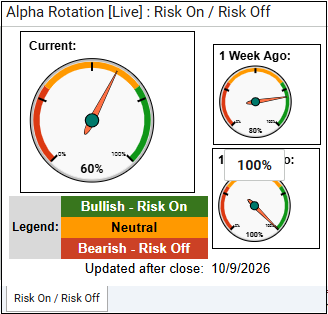 Every week we review the big picture of the market's technical condition as seen through the lens of our Big View data charts. Every week we review the big picture of the market's technical condition as seen through the lens of our Big View data charts.
The bullets provide a quick summary organized by conditions we see as being risk-on, risk-off, or neutral. The video analysis dives deeper. |
Summary: Market conditions showed meaningful improvement this week, with stronger breadth, recovering market internals, and low volatility supporting a cautiously bullish outlook despite mixed index performance. However, neutral risk gauges, uneven sector participation, potential topping action in semiconductors, and weakness in international equities suggest some uncertainty remains, making continued improvement in market breadth and support in the major indexes important for sustaining the recovery.
Risk On
Neutral
Risk Off
Maintain a cautiously bullish stance while looking for confirmation that improving market breadth and internals can support a sustained recovery. Favor selective exposure to growth and other sectors showing improving relative strength, while monitoring semiconductors for signs of a potential top that could signal broader weakness in technology. Watch DIA and IWM closely as they attempt to establish support around their 200-day moving averages, and look for continued improvement in market internals and risk gauges before increasing overall equity exposure. Remain cautious on international equities, particularly emerging markets, until they show signs of stabilization. With volatility near yearly lows and seasonal trends becoming more favorable, look for opportunities to add exposure on constructive pullbacks while maintaining disciplined stops and appropriate cash reserves to manage downside risk.

Every week you'll gain actionable insight with: