September 20, 2026
Weekly Market Outlook
By Geoff Bysshe

Summary
“It ain’t what you don’t know that gets you into trouble.
It’s what you know for sure that just ain’t so.”
The day-to-day interpretation of the direction of the market is very much in the eyes of the beholder, and the fundamental explanations for the moves are even more elastic.
If you think the market told you something last week based on the Fed’s decision to hike, or the market’s reaction to it, I’d suggest this is a good time to consider the wisdom in the quote above often attributed to Mark Twain.
Chair Warsh Continues To Give Guidance
Candidly, I wasn’t a fan of Chair Warsh after his first speech, when he said he'd focus on patiently adjusting the Fed’s process with the help of task forces and immediately reduce guidance.
However, since then he’s done the complete opposite, and the market has recognized this. He’s been very clear about how he’s thinking, what he’s looking at, and what he’s most focused on.
He’s also been extraordinary at asking the market to guide the Fed, rather than following the traditional path of the Fed guiding the market.
As a result, and...
...against the desires of the man who’d describe himself as the Chair’s boss,
...despite the fact that higher interest rates are unlikely to help reduce the largest contributor to the inflation war he’s fighting, and
...with the risk that the decision could hurt the parts of the economy buffering the stock market (and 40% of Americans' net worth) from the negative impacts of the Iran war,
Chair Warsh hiked the Fed Funds rates with a near-unanimous vote by Fed Funds markets and a unanimous vote by the Fed Governors.
The stock market initially sold off, but before the day ended, rational investors prevailed, and the reaction rally began. The bullish celebration continued on Thursday in the S&P 500, and even into Friday for the tech-heavy QQQ.
By the end of the week, the SPY, QQQ, and even the TLT (long bond ETF) were all higher than their open on Wednesday before the rate hike.
It’s Easy To Believe What You See Is True, But...
Stocks didn’t rally because the Fed hiked rates.
In fact, the equal-weight S&P 500 closed lower than Wednesday’s open. So did the S&P Mid Cap. ETF (MID), as did the broader Russell 2000 Index, IWM.
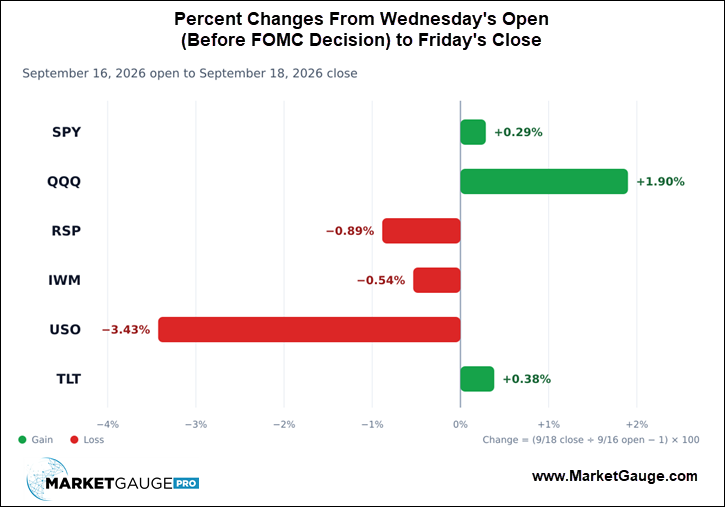
Additionally, it’s likely that stocks were only modestly reacting to the rate hike at all, because crude oil, which has been driving the price of stocks, began to sell off on Wednesday, then accelerated lower overnight, which is when 100% of the S&P 500’s “Thursday gains” occurred.
However, as economists like to say, holding crude oil prices constant, the FOMC decision probably significantly contributed to the bullish bias for the balance of the week for two reasons:
In short, the FOMC meeting and decision removed uncertainty that had been building since the Jackson Hole meeting.
One small bit of supporting evidence of this point of view is that the VIX (often referred to as the fear gauge) fell 17% from Wednesday’s open to Friday’s close at 14.81. The VIX’s closing low is 14.25.
What Does The Market’s New “Clearer View” Look Like?
Since a renewed move downward in the long bond started in late June and was reinforced at the end of July, when Chair Warsh didn’t raise rates and gave a press conference that disappointed the bond market, the stock market has been grappling with what Warsh’s policy would be.
As you can see in the recent data on the chart below, the expectations for Fed rate hikes dropped going into August. This led to the SPY break out to new highs.
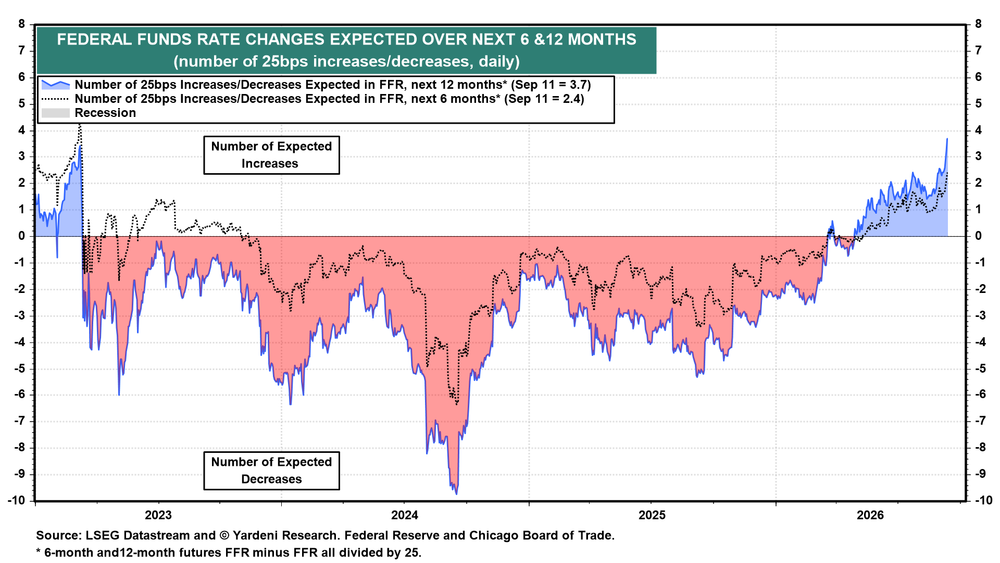
However, long rates continued to climb, resumed their move higher, and Warsh began to become more clearly hawkish.
Expectations leading up to the last meetings were increasingly one-sided that a new rate-hiking cycle would begin. “One and done” rate hikes are unlikely.
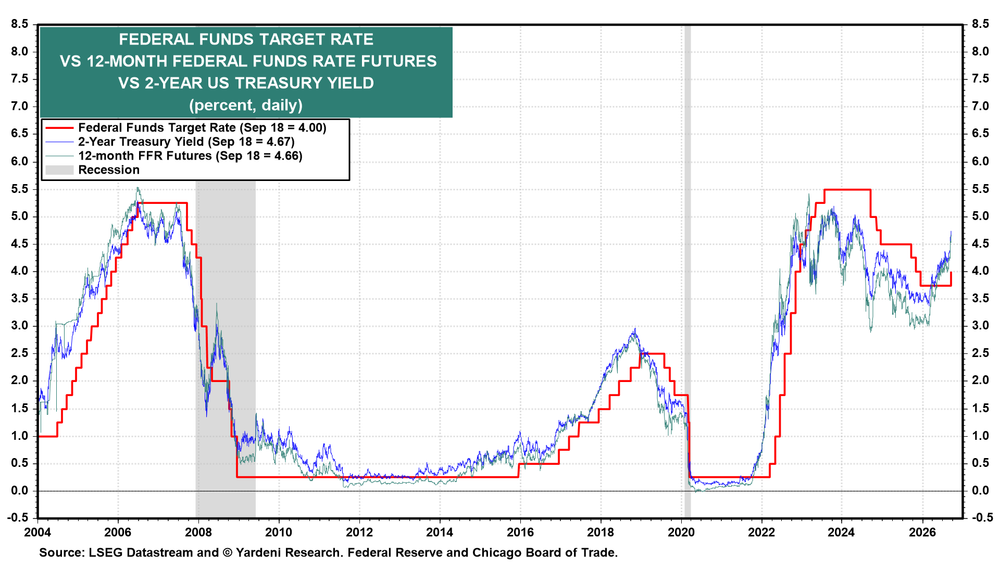
As you can see in the chart above, currently it’s very clear that the market is expecting more rate hikes. This is much more in line with market rates, i.e. the 30-year bond at the highest rates in decades and the 2-year trading well above the Fed Funds rate (shown below).
The market’s new clearer view is that it tends to be more comfortable when it believes the Fed is worried and focused on the right thing.
The hike in the Fed Funds rate on the chart below shows the Fed is adjusting towards the level where the market’s rates have already determined they should be.
Oil Is Still Driving Stocks’ Short-term Moves
In last week’s Market Outlook, ”Can Stocks Overcome These 3 Bearish Narratives?“ we focused on how oil, and more specifically diesel prices, were the biggest factor in short-term price moves in the market.
While there doesn’t appear to be any fundamental reason for oil to stop going higher, last week’s price action created inflection points worth noting that could help time the beginning of a noteworthy decline.
The Crude Oil ETF, USO, pulled back to its recent breakout level of the high from the Iran war. This lines up with the 10-day moving average a close and continue pattern below this level (around 150) would be a typical reliable reversal pattern.
Additionally, you’ll see Real Motion (the MarketGauge momentum indicator) showing the dots (one-day reading) sitting at the same level that represented the last peak in USO in July. The dots will often find support and resistance at levels because they represent levels of extension or “stretch” from a baseline moving average.
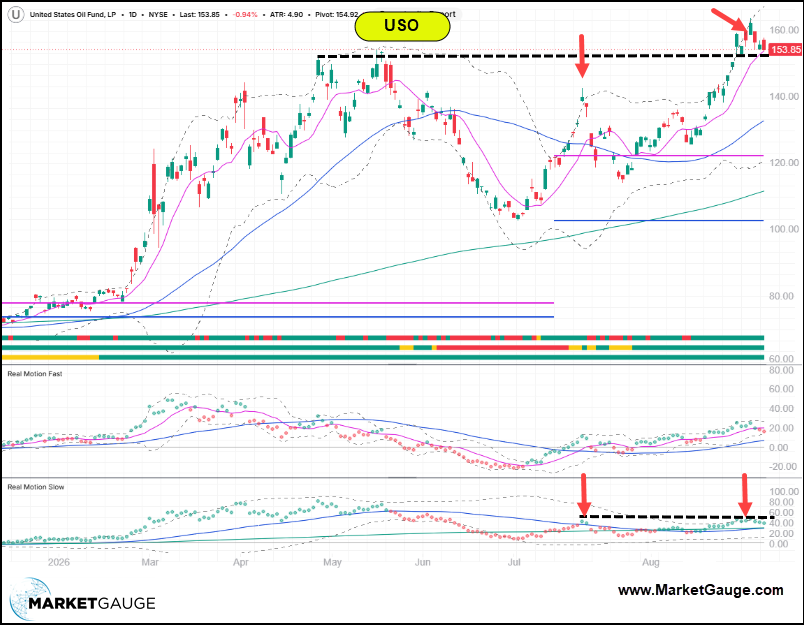
Click here to see this USO chart live
Historical Perspective
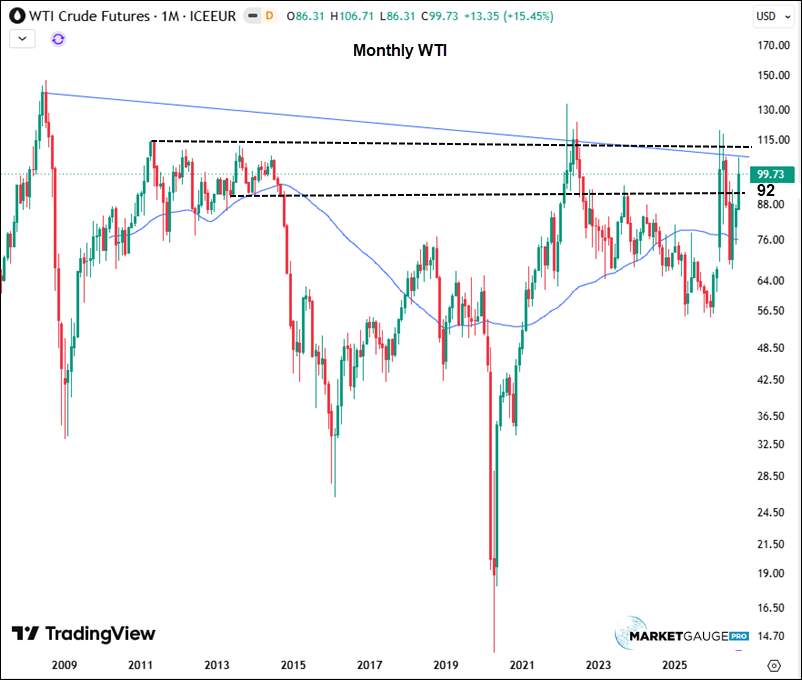
USO may have hit a new high relative to the Iran war move, but WTI did not and it to sits at a level that has been important in the past.
The monthly chart below shows that WTI has a lot of resistance immediately above its current level, and a close below 92 would put it on the bearish side of that pivotal level.
The Real Energy Problem
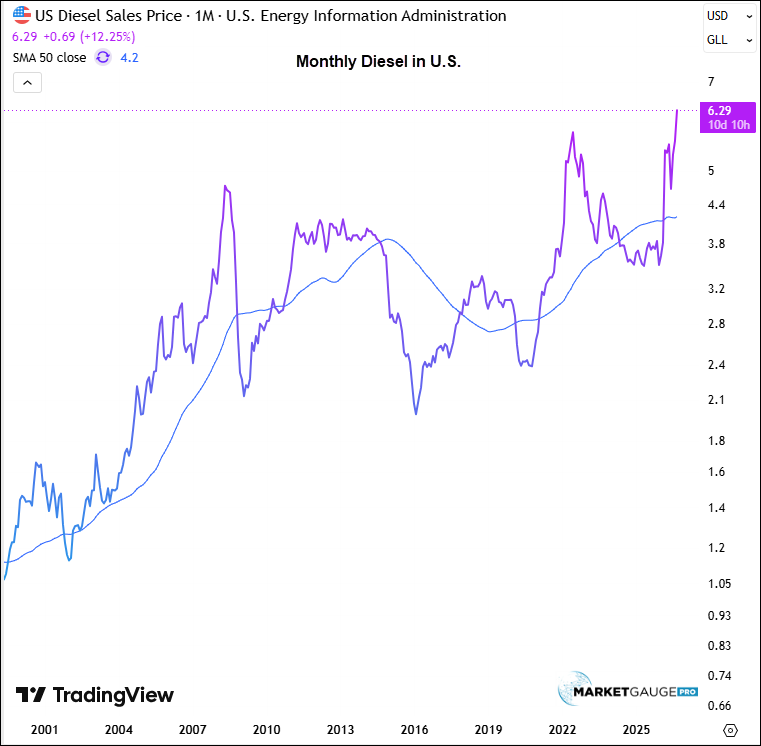
The Crude Oil charts can look toppy, but that doesn’t mean Diesel has topped. It still looks strong; it won’t necessarily fall if Crude does, and as we pointed out in last week’s article, this is the key to inflation retreating.
Earnings Expectations Are Driving Long-term Direction.
Ranges Are Your Guideposts.
As we discussed in the beginning of this article, the broader market (RSP and IWM) didn’t rally after the rate hike (even with lower oil prices). The tech sector did, however.
The tech sector has several advantages.
For these reasons, and its shift into a positive momentum phase, we’ve focused your attention on MAGS as a theme. The chart below illustrates how you can see shifts in momentum with Real Motion indicators, and then catch trend changes as a result.
When Real Motion shifts from bullish to bearish (or vice versa), expect a subsequent break in a price inflection point in the same direction to follow through.
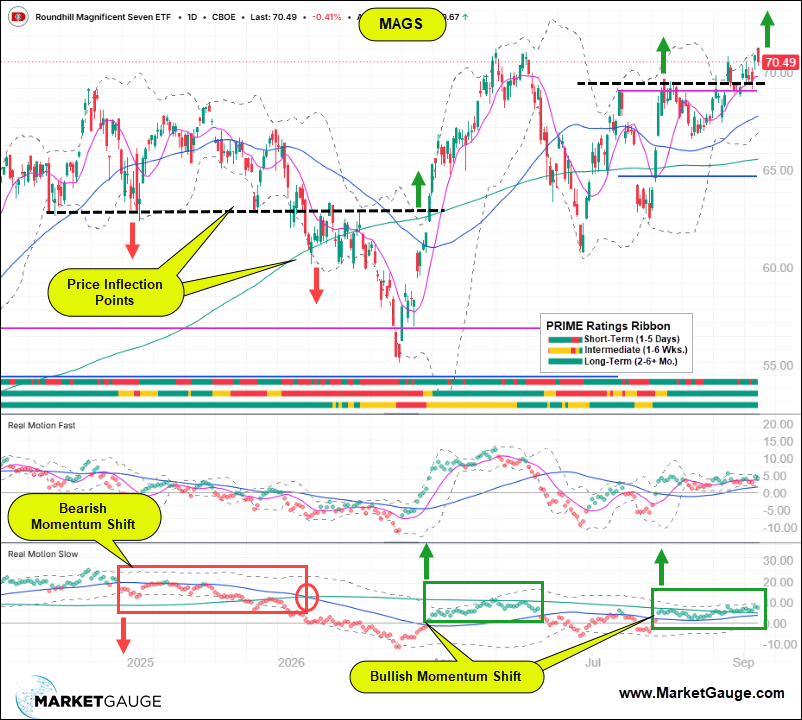
For the current and interactive MAGS chart click here
SMH is a current example of a bullish divergence in its faster Real Motion momentum indicator (10-day vs. 50 day).
In the chart below, you can see how the bearish divergence warned not to trust the 50-day support in July, and now the bullish divergence suggests that a confirmed break over the 50 DMA should lead to a new up move.
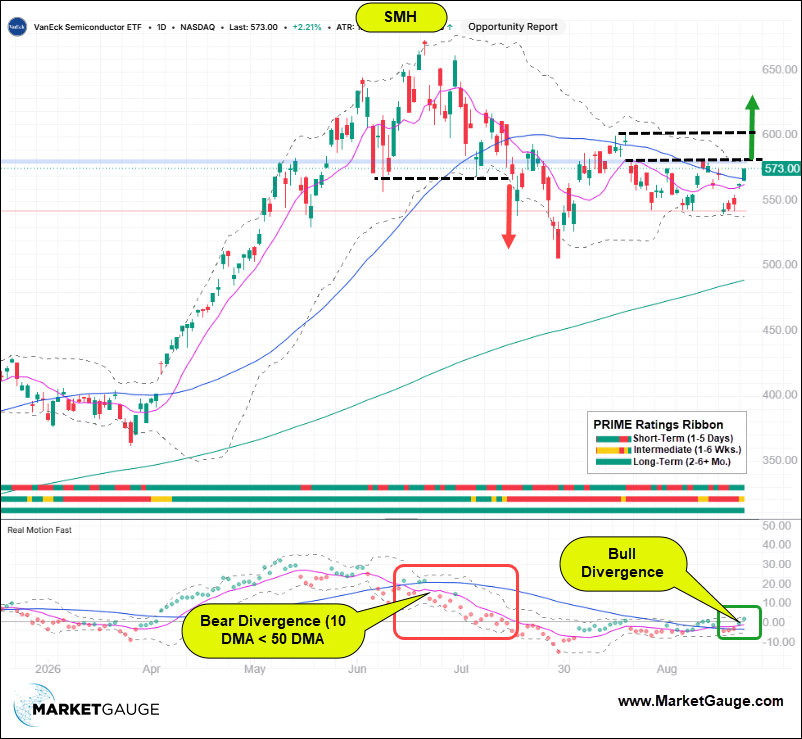
Click here for the interactive SMH chart
If SMH breaks out, then QQQ will look equally as set up for a rally with a break over the closing trendline from the highs and the marked level of 725.
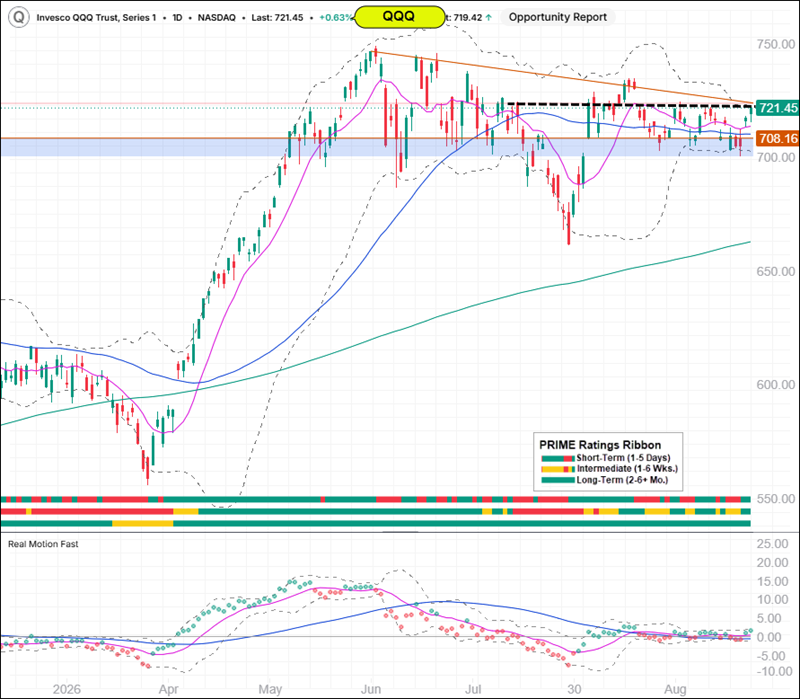
Click here for an interactive chart of QQQ
Conclusion
The additional clarity on the direction of the Fed will enable the market to rotate into the stocks it wants to be positioned in heading into the upcoming earnings season, with a bias toward another rate hike coming soon.
Don’t try to be an economist stock picker; let the market show you which stocks are headed higher and which need to wait for more accommodating conditions.
Stocks We’re Watching This Week
In our Active Investing Edge, we’ve focused on the market’s shift to bigger-cap, higher-quality, stronger-momentum names.
MAGS, for example, as a theme, and last week we suggested focusing on AMD because it was one of the stronger chip names. It and several others in its cohort (INTC, MU, SNDK, NVDA) are well positioned for a new move up.
Outside of big tech, there are a lot of interesting leaders in their domains.
HOOD has a very compelling “E” component of the PRIME analysis. It’s a leader in pushing into new trends in active investing for individuals and investment advisors.
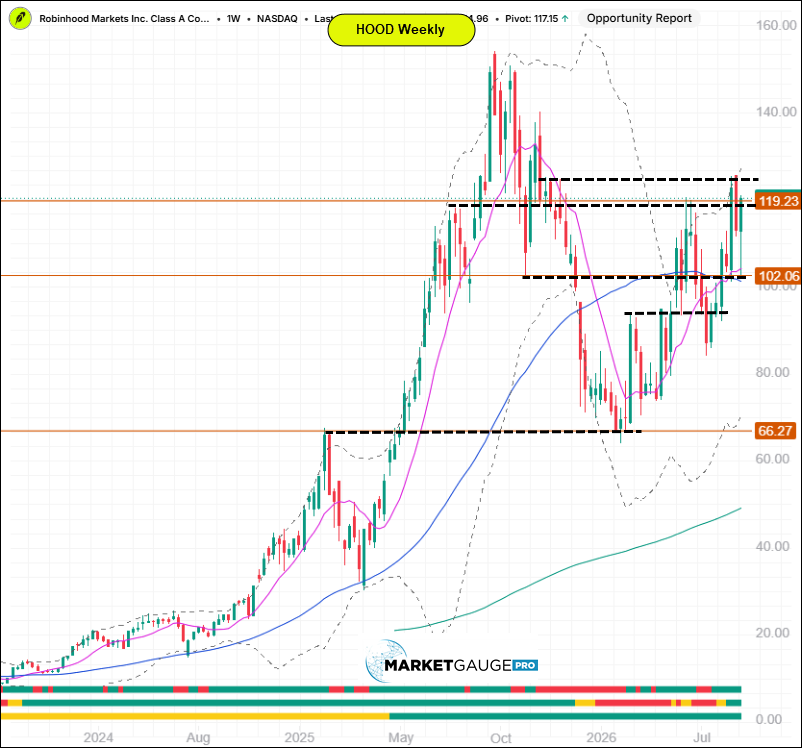
As a result, in the Active Investing Edge, we’ve focused on identifying entry points since its weekly bounce off the $66 area.
As you can see from the weekly chart below, this stock is very good at respecting well-defined levels.
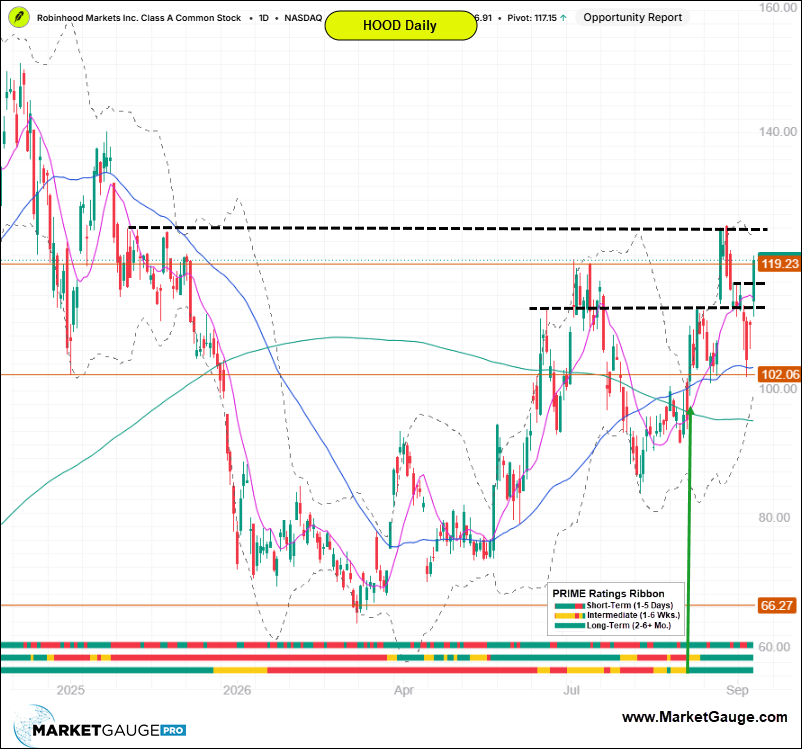
Recently, all the PRIME factors turned green in 2 of the three daily time frames after it also broke above its 50-day MA. As shown below by the green arrow. After an orderly retracement back to the 50-day, Friday it exploded higher again.
Friday’s catalyst was likely crypto-related, but other catalyst drivers include Trump accounts, tokenization, and generally bullish market conditions.
For an interactive chart on HOOD click here
Friday’s big range and the nearby inflection points will likely create good entry points this week.
If you’re an individual investor or an advisor, and would like help navigating the everchanging dominant themes in the market with strategies, tools, automated trading systems or professional advisory services, contact us:
Best wishes for your trading,
Geoff Bysshe
Co-Founder
(Connect on LinkedIn)
 |
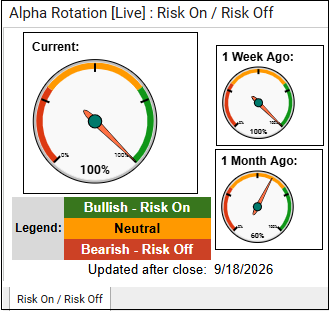 Every week we review the big picture of the market's technical condition as seen through the lens of our Big View data charts. Every week we review the big picture of the market's technical condition as seen through the lens of our Big View data charts.
The bullets provide a quick summary organized by conditions we see as being risk-on, risk-off, or neutral. The video analysis dives deeper. |
Summary: Markets remain broadly risk-on, supported by strength in technology and growth, low volatility, positive risk gauges, and resilient foreign equities, though weakness in small caps, value, and market breadth points to an increasingly narrow advance. Internal measures remain soft and bonds continue to reflect a higher-for-longer rate environment following the Fed decision, leaving the market vulnerable to seasonal weakness despite several oversold areas that could support a near-term rebound.
Risk On
Neutral
Risk Off
Maintain a cautiously risk-on posture, favoring technology, growth, semiconductors, biotech, and stronger emerging markets while keeping overall exposure controlled given weak breadth and continued pressure in small caps and cyclically sensitive areas. Look for selective opportunities in oversold IWM, retail, and transportation if momentum begins to improve, but avoid anticipating a bottom without confirmation.
Keep some dry powder available through the seasonally weaker September period and watch for improvement in market internals, new highs/new lows, and the percentage of stocks above key moving averages before becoming more aggressive. With bond yields remaining elevated after the Fed decision, be prepared to reduce exposure if rates push materially higher and begin pressuring growth leadership; conversely, stabilizing yields alongside improving breadth would support adding risk.
****There will not be a video this week

Every week you'll gain actionable insight with: