September 13, 2026
Weekly Market Outlook
By Geoff Bysshe

Before this week’s Market Outlook, we’d like to take a moment to remember all those impacted by 9/11 and share a personal experience from that day.
Never Forget — Remembering Ari Jacobs
September 11 will always be deeply personal to me.
Twenty-five years ago, I was supposed to attend the Waters Technology conference at the World Trade Center with my dear friend and business partner, Ari Jacobs, who had invited me. At the last moment, I changed my plans and went to our office instead. Ari attended the conference and never made it out.
Ari was an extraordinary person—one of the youngest CEOs in financial technology, a gifted leader and, most importantly, a wonderful friend with an unforgettable sense of humor. His loss remains part of MarketGauge’s history and our story. Even those on our team who were not with us then know what Ari meant to us.
It still feels surreal that a last-minute decision kept me away that morning. On this anniversary, I remember Ari, everyone who lost their lives that day, and the families, friends and colleagues who continue to carry their memories.
I miss you, Ari—your friendship, your leadership and especially your sense of humor.
Never forget.
.
Keith Schneider
CEO, MarketGauge
This week the stock market will react to a Fed decision on whether or not to raise the Fed Funds target rate.
The futures markets are pricing the probability of a hike at over 85%.
Last week ECB raised its deposit rate for the second time since the war Iran began. It was a unanimous vote and one that President Christine Lagarde called “a no brainer.” Traders are now pricing in more hike by October.
At this point, a bigger shock to the stock market may be a decision to ‘hold’.
Despite what appears to be an obvious conclusion that the Fed will hike rates on Wednesday, the SPY and QQQ closed last week 2% and 4% from their all-time highs respectively.
Yes. Some do others don’t.
As soon as the Fed starts hiking, the “restrictive” narratives and sentiment become more potent threats to stocks. You can see it in the market’s rotation.
In late June when the tech leadership was beginning to pull back our July 5th issue of Market Outlook was titled, “What Will Happen To The Market If Tech Cracks, Corrects or Crashes?”
The conclusion of the article was simply - no problem, so long as the broader market, easily measured by the equal weight S&P ETF (RSP), picks up the slack.
Since the SMH peak on June 22nd, it corrected as much as 25% and many of its biggest winners corrected 40% or more. However, the SPY and QQQ bottomed with less than 12% drawdowns and SPY has since returned to new all-time highs.
Importantly, from June 22nd until mid-August, the RSP rallied 6%.
The Chair Warsh’s Jackson Hole speech kicked of a new and different wave of market rotation. We covered this in the Market Outlook on Aug. 28th, “Clear Market Moves From A Clear Message From Chair Warsh.”
The Fed Funds probability market has moved from about a 35% chance of a hike in the September meeting to current expectations of over 85%.
With the increased expectations of rate hikes the RSP has fallen 4% which is a sizable move for this ETF, its largest drawdown since the March 2026 lows, and a clear signal that the broader market does not like the idea of higher rates. The IWM has a similar pattern.
As we said in last week’s article, now it’s time for the less interest rate sensitive stocks like the Mag 7 (MAGS) to step up.
On Wednesday, the markets will be evaluating the likelihood of the FOMC moving to a position of multiple hikes like the ECB has already demonstrated.
After the FOMC announcement the market will price in the expected number of rate hikes looking forward and stock investors should focus on how the long bonds respond and which segments of the stock market out and under perform on Wednesday and for the balance of the week.
There isn’t a magic number of hikes that break the stock market, but there is always a market narrative that does. The first hike will likely change the tone of the narrative, after that, focus on the markets not the number of Fed hikes.
It’s not a big leap to expect that bearish narratives around higher rates, and/or inflation leading to slower earnings growth will become more believable if the Fed is viewed as restrictive.
Restrictive will still be a subject to interpretation, but with the direction of Fed Policy being hikes, it’s harder to dismiss the claim. Policy makers and investors can claim to be ‘data driven’ but markets are emotional and hikes don’t feel bullish.
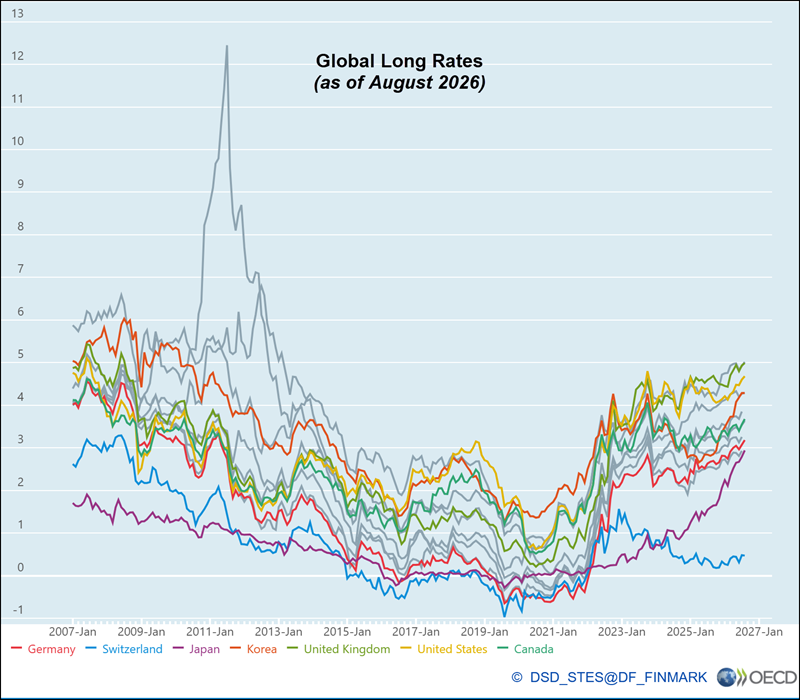
Long term rates have been going up for over 5 years, and they’re going up globally. The US can be “exceptional”, but we’re not immune to the global pressures of higher long-term rates.
The chart below shows the consistency of the long-term rates globally.
There isn’t one ingredient of inflation that can take all the credit or blame for the direction of inflation, but diesel prices have a widespread impact on inflation and the potential to hurt corporate margins.
The table below shows periods when diesel prices rose 25% or more over the course of 12 months. The first line of each section in white shows the CPI and Core at the beginning of the rise. The next line shows the peak of the cycle in diesel prices and the subsequent rows show the retracement in prices (blue area) and inflation metrics 3, 6 and 12 months after the peak prices.
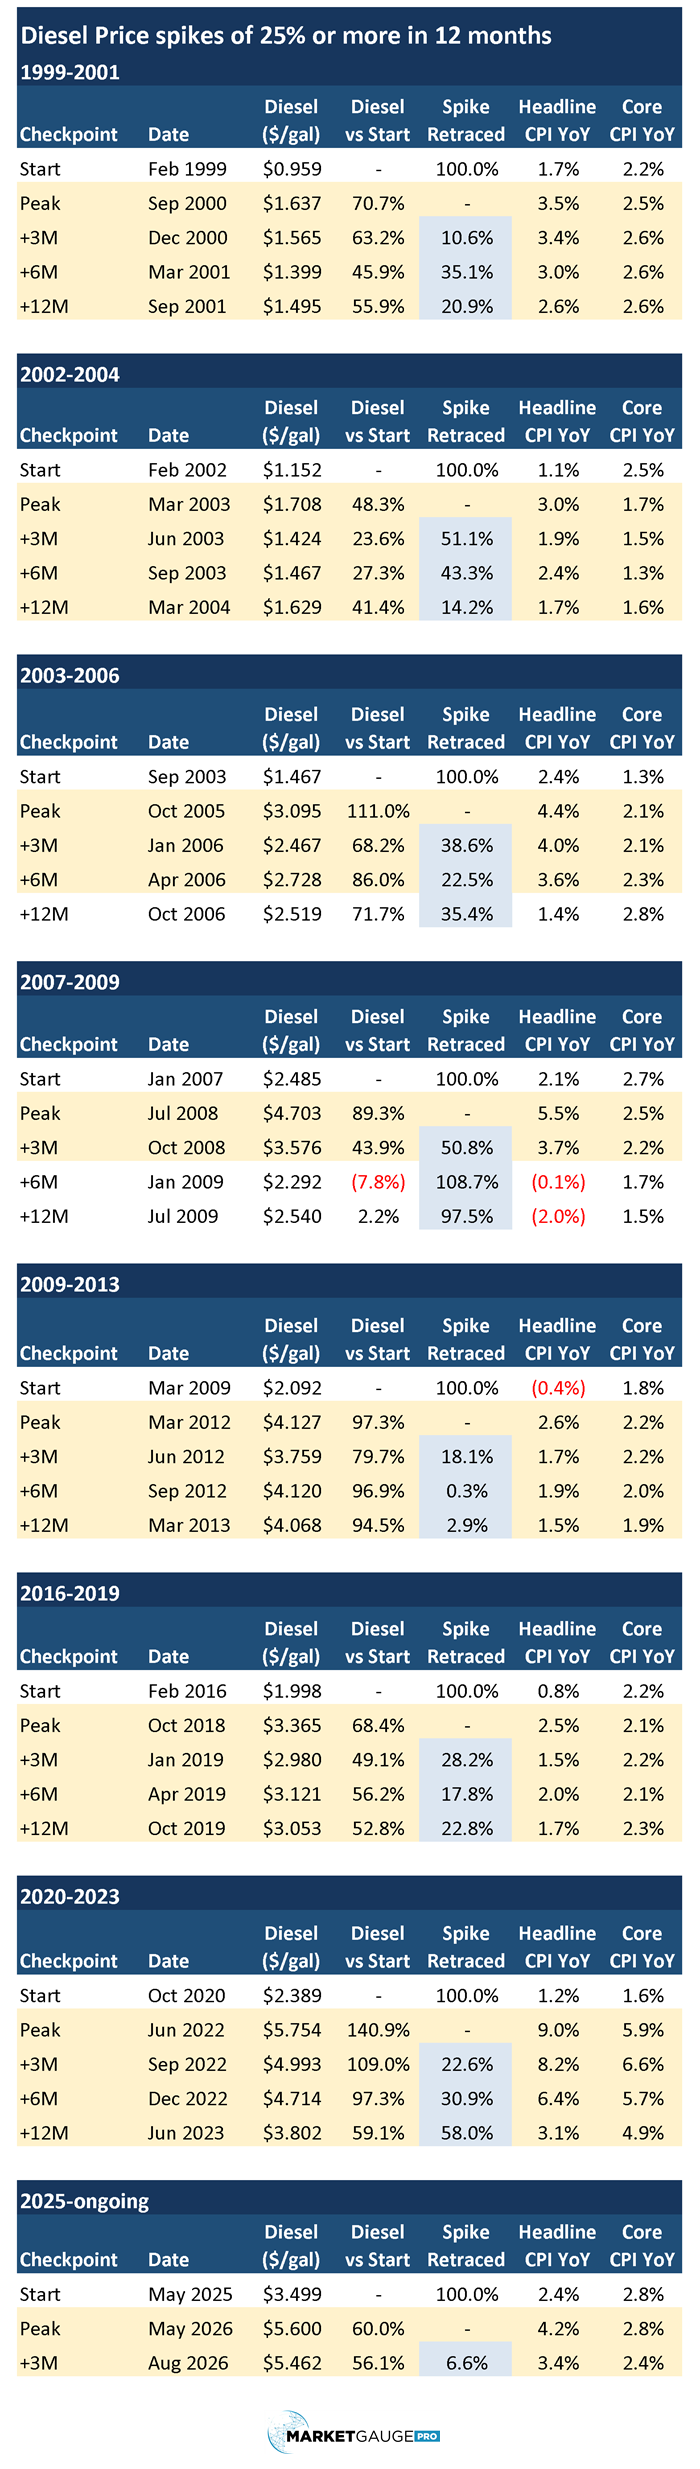
The global financial crisis in the 2007-2009 period was not driven by diesel prices.
The other periods do seem to show that inflation will not retreat without a substantial sell off in diesel prices from their peak.
Last week escalation in the war with Houthi’s forced Saudi Arabia shut down the pipeline that has been used to transport oil to ports away from the Straight of Hormuz. While this is expected to be a temporary shut down, it’s a clear sign that critical energy infrastructure is increasingly at risk globally, not just in the Straight of Hormuz.
Additionally, China reduced its demand for middle eastern oil at the start of the war with Iran, but it’s now buying again.
The global pressure on oil demand and refined products, like diesel, is not something the Fed can influence in its efforts to bring down inflation.
The simple relationship that matters as a result is if inflation is higher for longer the Fed will be under more pressure to maintain restrictive policies that could do little to reduce the higher energy prices that will threaten corporate margins and consumer demand.
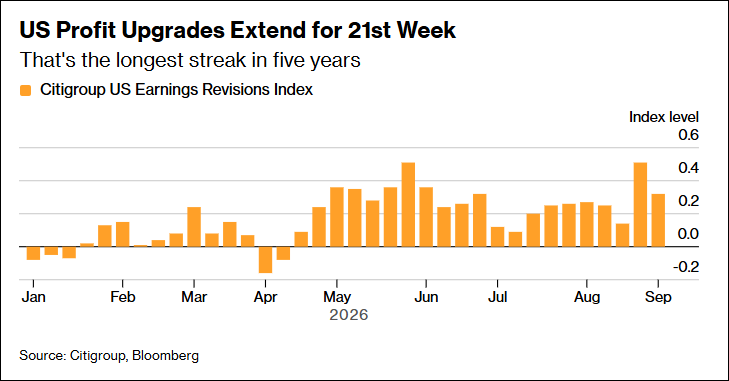
Corporate earnings growth has been the primary engine of strength and confidence for this bull market.
Reported earnings aren’t just strong, the expectations of future earnings are getting stronger too. The chart below shows earnings upward revisions outnumbering downward revisions for the 21st week in a row – the longest streak in 5 years.
Equity valuations are at levels that are likely to support current price levels as long as investors believe that earnings can grow despite higher rates, inflation and energy costs.
With all the momentum in support of the AI capital spending boom from both corporations and the government, it’s unlikely that an earnings slowdown will happen without ample warning for anyone on the lookout for the signs of trouble coming from the companies themselves.
Early indicators may include, difficulty getting a major bond deal done, analysts beginning to lower estimates, earnings calls revealing lower margins and lowering revenue and earnings guidance. None of this is currently happening in a meaningful way.
However, a Fed that is hiking rates will provide a new and more credible backdrop for bearish macro headwinds and narratives that will continue to provide the much appreciated temporary corrections and the wall of worry that the bulls have been so adept at navigating and climbing.
One risk that has been playing out since the Jackson Hole meeting is the narrowing of market leadership as we discussed at the top of this article.
It’s time to get more selective.
One way to get more selective is to use our PRIME framework as we demonstrated in last week’s article, “Are The Mag 7 Looking To Lead The Market Again?“ for how to be selective with and within the Mag 7 stocks and their ETF, MAGS.
MAGS Confirmed Last Week’s Call
Despite last week’s market weakness the MAGS ETF held up well and looks positioned to move higher. It’s been coiling for months will all three PRIME time frame ribbons being bullish. This is the first breakout with this bullish condition. If it goes the Mag 7 is back in the driver’s seat.
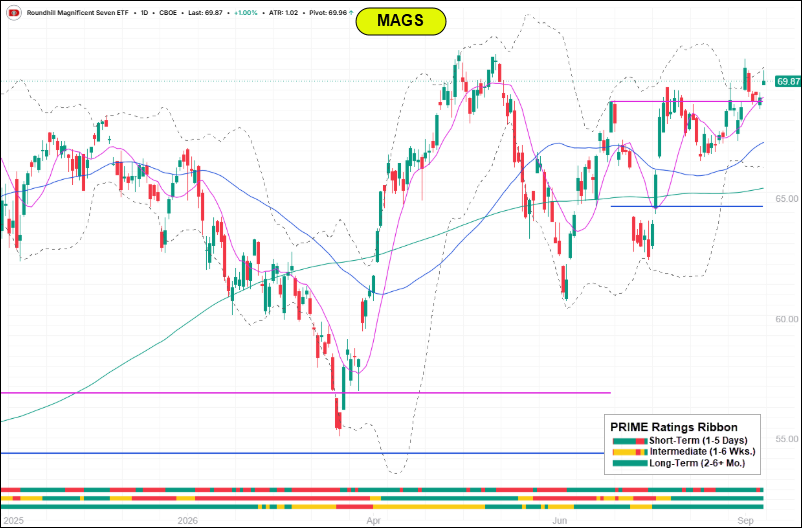
Click here for an interactive MAGS chart
Counter Intuitive But A Rate Hike May Boost Visa
Visa and the financials could be pushed either way by the market’s reaction to the Wednesday FOMC decision. Higher rates may not be what the consumer wants, but this chart suggests it may be good for Visa. If Visa (V) trades back over 375, it’s set up for a move to new highs.
Every dip since its PRIME Ribbon turned green in all time frames has been a buy.
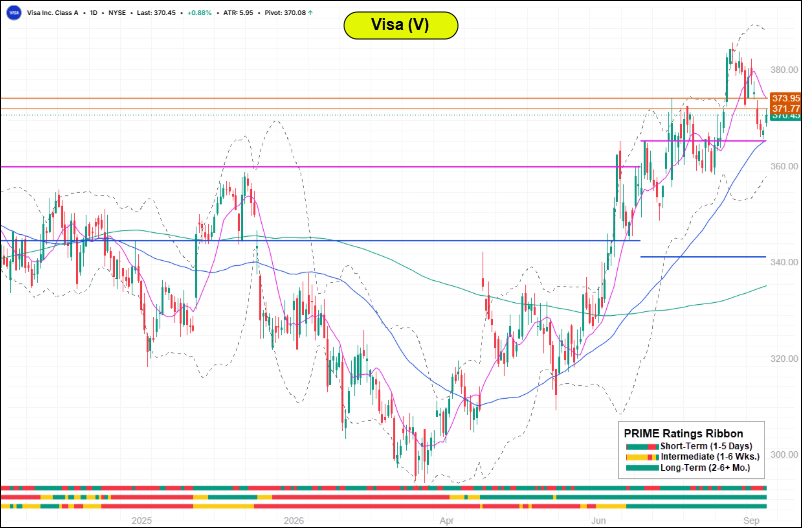
Click here for an interactive chart on V
AMD and Intel may be the CPU ‘tell’.
After many of the chip stocks got crushed in late July they bounced back and set a swing high in mid-August. Our Opportunity Report is long Intel and looking to add AMD to our portfolio if confirms this week with a July Calendar Range Reversal buy.
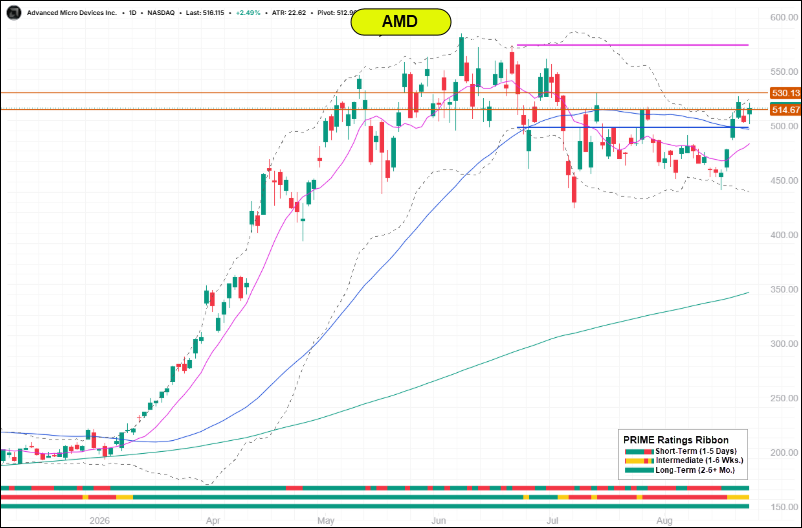
Click here for an interactive chart on AMD
If you’re an individual investor or an advisor, and would like help navigating the everchanging dominant themes in the market with strategies, tools, automated trading systems or professional advisory services, contact us:
Best wishes for your trading,
Geoff Bysshe
Co-Founder
(Connect on LinkedIn)
 |
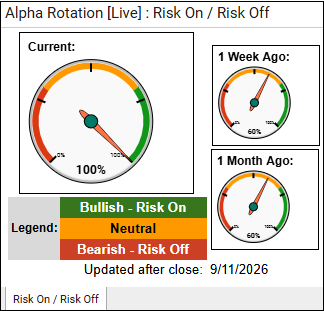 Every week we review the big picture of the market's technical condition as seen through the lens of our Big View data charts. Every week we review the big picture of the market's technical condition as seen through the lens of our Big View data charts.
The bullets provide a quick summary organized by conditions we see as being risk-on, risk-off, or neutral. The video analysis dives deeper. |
Summary: Markets weakened this week, with deteriorating breadth, momentum, volume patterns, and bonds creating meaningful headwinds, while September seasonality adds another layer of caution. However, low volatility, improving risk gauges, continued strength in growth, technology, emerging markets, and Bitcoin, and intact longer-term trends suggest this is more of a near-term deterioration within a broader risk-on backdrop than a decisive risk-off shift.
Risk On
Neutral
Risk Off
Maintain a cautious risk-on posture, but reduce exposure to weaker areas of the market as deteriorating breadth, momentum, and volume suggest the current pullback could have further to run. Favor relative-strength leaders—particularly technology, semiconductors, select growth stocks, emerging markets, and potentially Bitcoin—while avoiding or trimming positions that have broken their 50-day moving averages or are showing persistent distribution.
Keep some dry powder and use the 50-day moving average as an important tactical risk level across equities, gold, and commodities. A recovery in breadth and momentum would support adding exposure, while further deterioration—especially weakness spreading into technology, failure of the major indexes to regain their 50-day averages, or continued pressure from rising rates and weak bonds—would argue for raising cash and becoming more defensive.
Watch oil and interest rates closely as key macro risks. Oil's surge toward new highs and continued bond weakness could pressure inflation expectations and equity valuations, while September's historically weak seasonality reinforces the case for tighter stops, smaller position sizes, and selective rather than broad-based buying.
**There will not be a video this week

Every week you'll gain actionable insight with: