September 27, 2026
Weekly Market Outlook
By Geoff Bysshe

September Wasn’t Nice To Stocks
Since the tech trade (SMH) peaked earlier this year, the market demonstrated its resilience as the equal-weighted S&P 500 (RSP) and the IWM moved higher, while SMH moved lower.
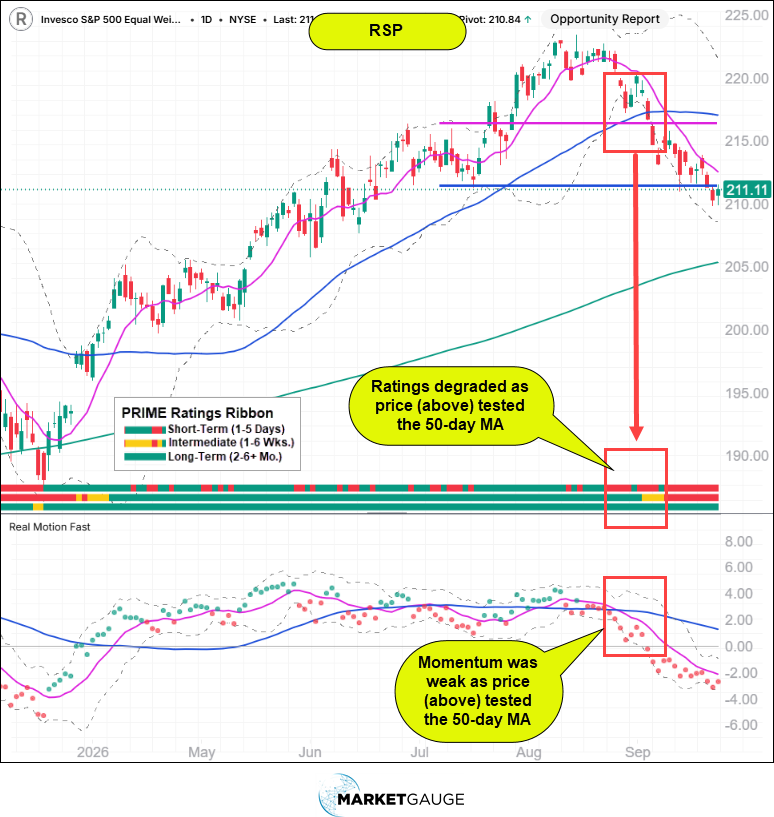
Nothing lasts forever, and with ample warning, the RSP and IWM peaked in August and broke down in September.
The chart below shows how we’ve been tracking the degrading conditions led by a rollover in momentum (Real Motion) leading up to price testing the 50-day MA. When 50-day MAs break with leading divergences in Real Motion, the break tends to be prolonged.
For a live chart of RSP go here
The weakness in the broader market makes sense.
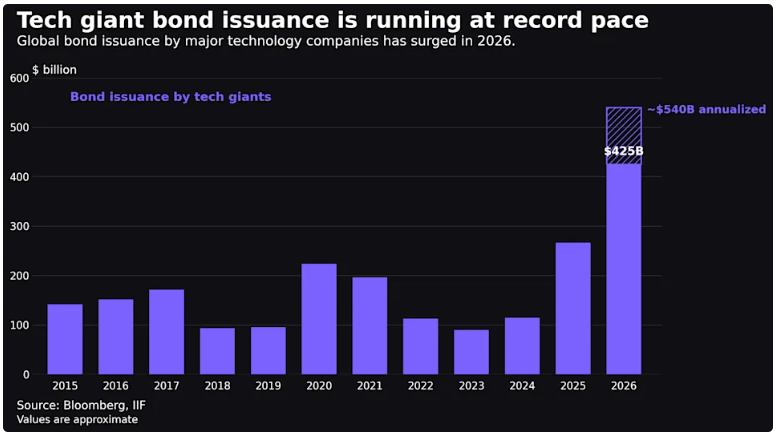
For market participants that prefer certainty over the unknown, it seems pretty clear that for the balance of the year the trend in rates will be higher, energy prices will remain elevated, the supply of debt will be historic, and the Fed will remain inclined to hike again.
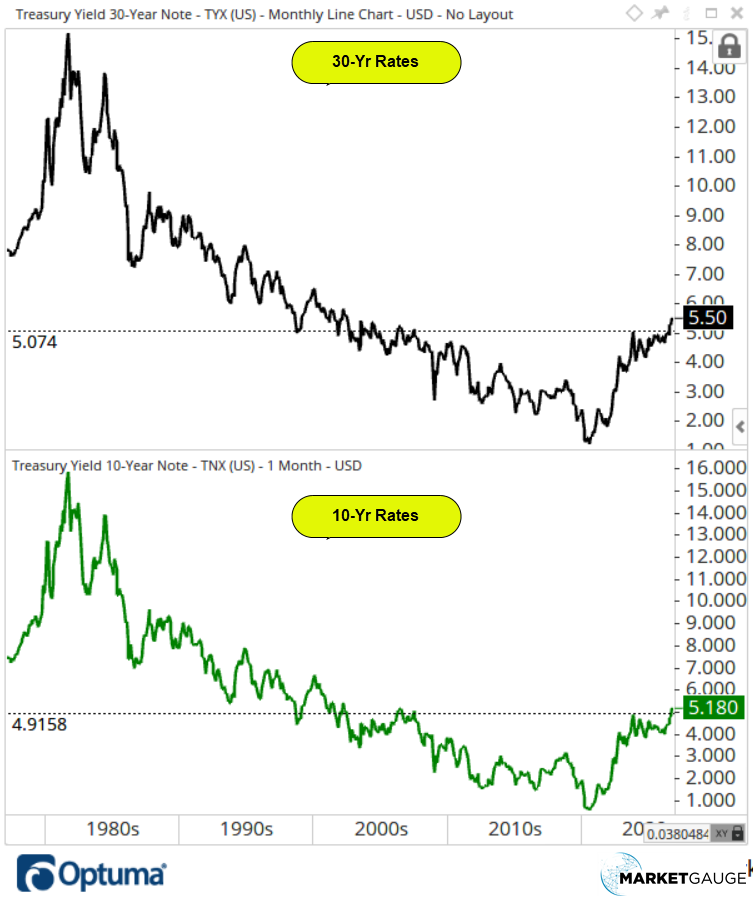
The breakout in long rates is looking more and more bullish (for higher rates)!
September Wasn’t All Bad - It Revealed What’s Coming.
The rotation in September may not prove to be a popular narrative. Market commentators love to complain about narrow market leadership, but in the current environment it makes sense, and it’s working.
September revealed what’s likely to lead through the elections and into year-end.
The new story is the same as the old story – big-cap tech and businesses that are less sensitive to higher rates and have institutional demand are leading and will likely continue to lead.
There are certainly risks, but when you know what’s leading, you can see when risks become a problem.
Below is the month-to-date ranking of sectors, which shows which areas moved higher as the broader market (under the indexes) moved lower.
As you can see, only a few areas are bullish: oil, semiconductors, tech, and cryptocurrencies. Biotech and healthcare were modestly positive, but do have strong ratings in all time frames.
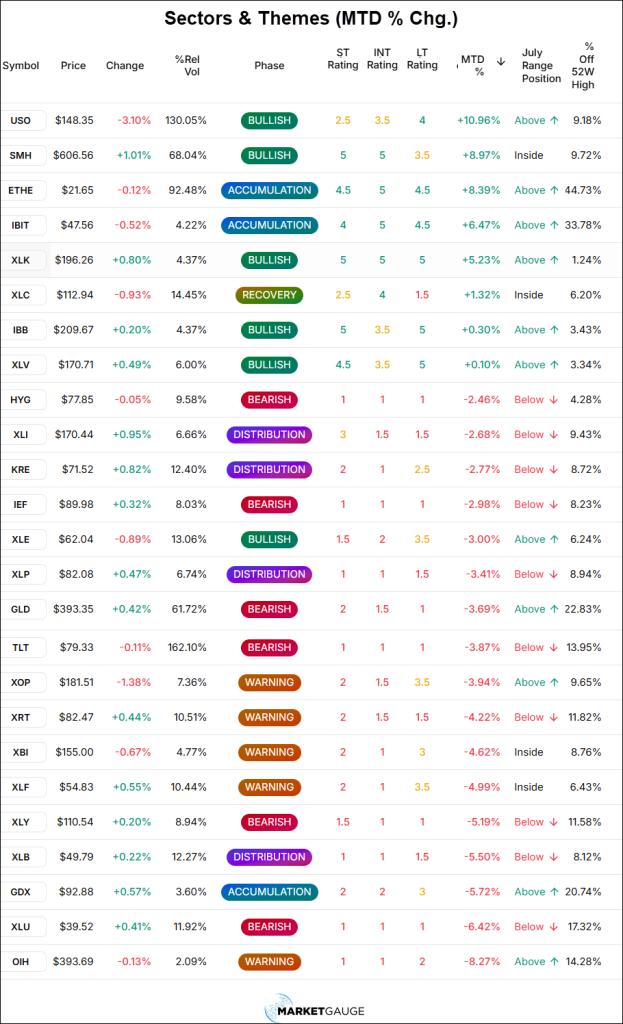
The risk is very clear. If tech (XLK) and SMH roll over, the market will be in trouble unless RSP, IWM, and several sectors improve dramatically. It’s unlikely the broad market will rescue a weak tech and SMH move given the strong downtrend in bonds.
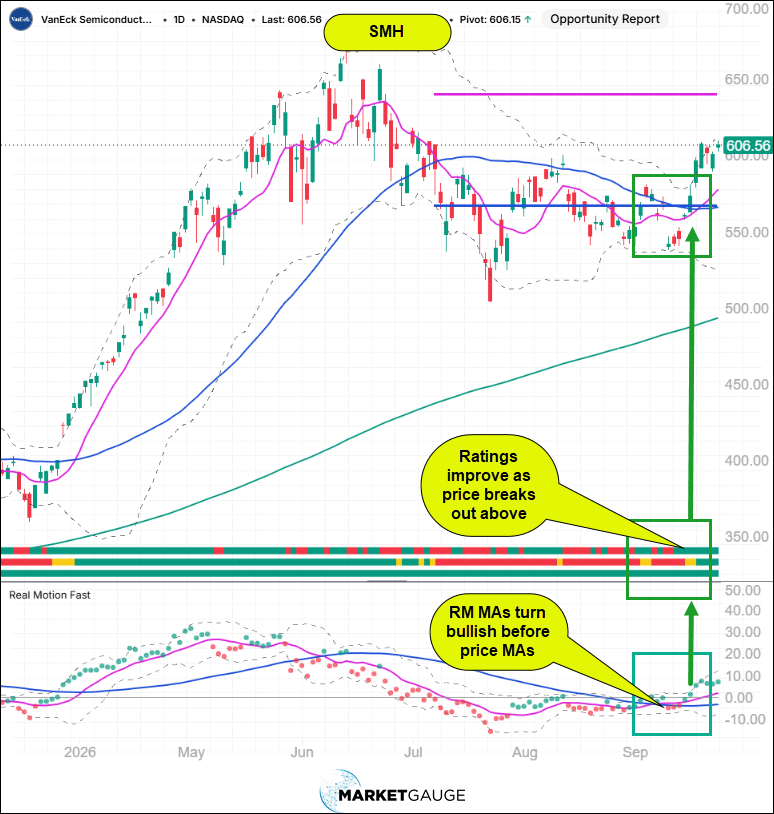
How strong is SMH, and who’s leading it?
As you can see below, the ratings and the RM momentum pattern in SMH are the opposite of the bearish break of the 50-day in RSP above. Here it’s a bullish divergence break higher.
For a live chart of SMH go here
The PRIME Playbook Considering The September Rotation
If we look at the market through the lens of our PRIME framework, the best stocks in the current environment look like this:
“P” – Price action should be in a bullish phase, or a phase where price action is above the 50 and the MA’s conditions are likely to turn bullish
“R” – Relative Strength leadership is what’s working. In a market where breadth is deteriorating, leadership indicators (Triple Play Price Performance) are your best friend.
“I” – Institutional demand as measured by the volume trend is important to confirm leadership and a warning sign if it falls off.
“M” – Momentum is the best way to see the rotation in the current market. Most recovering leaders are also recovering from a bear-market momentum decline that began early this year. The best stocks will be above their 50-day with good momentum. Beware of momentum charts that look like the RSP chart above that are declining to (or worse) breaking their 50-day.
“E” – Several expected growth stories will likely get the most bullish investors’ attention. Strong earnings expectations are still working, but a new AI narrative theme is also boosting stocks’ performance (see AAPL Hopefully Learned From META and MSFT below).
The SMH Components From a PRIME Perspective
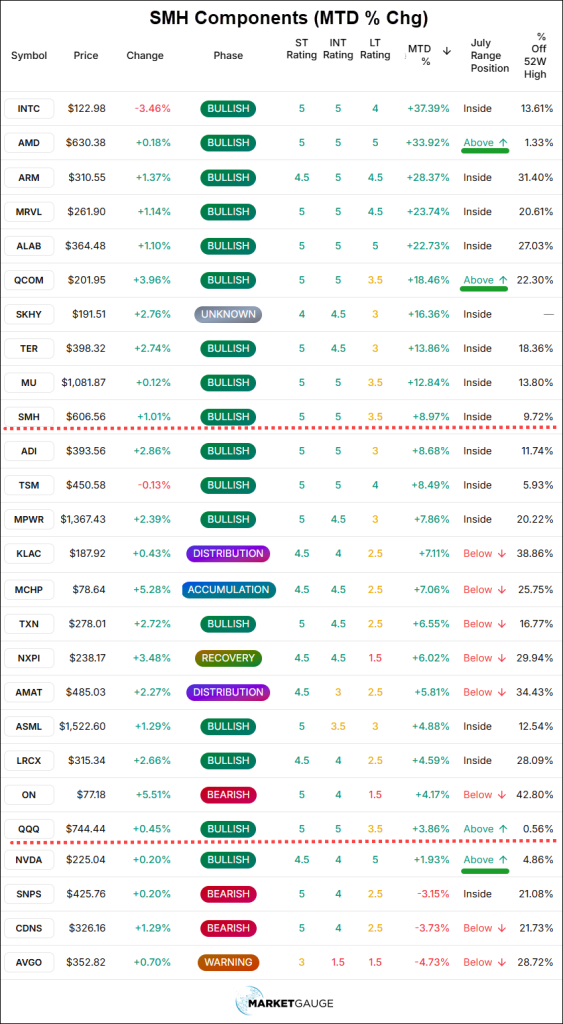
The list below includes the SMH and QQQ to provide perspective from their performance.
Note also that there are only 3 stocks trading over their July Calendar Range in this ETF, AMD, QCOM, and NVDA. All have very different charts but look good in their own way.
Additionally, none are as close to their 52-week high as QQQ. This suggests that while this group of stocks may be seen as a leader, other tech stocks are pushing the QQQ higher.
MU Reports On Wednesday
Micron, MU, reports earnings on Wed. 9/30. While it’s expected to report very bullish earnings, the market’s reaction is less certain. With uptrends resuming in many stocks in its cohort, a bullish report for Micron could accelerate gains across the group, but if there's disappointment, the market is vulnerable, as discussed above.
Keep your eye on this group's reaction to the MU earnings.
AAPL Hopefully Learned A Lesson From META and MSFT
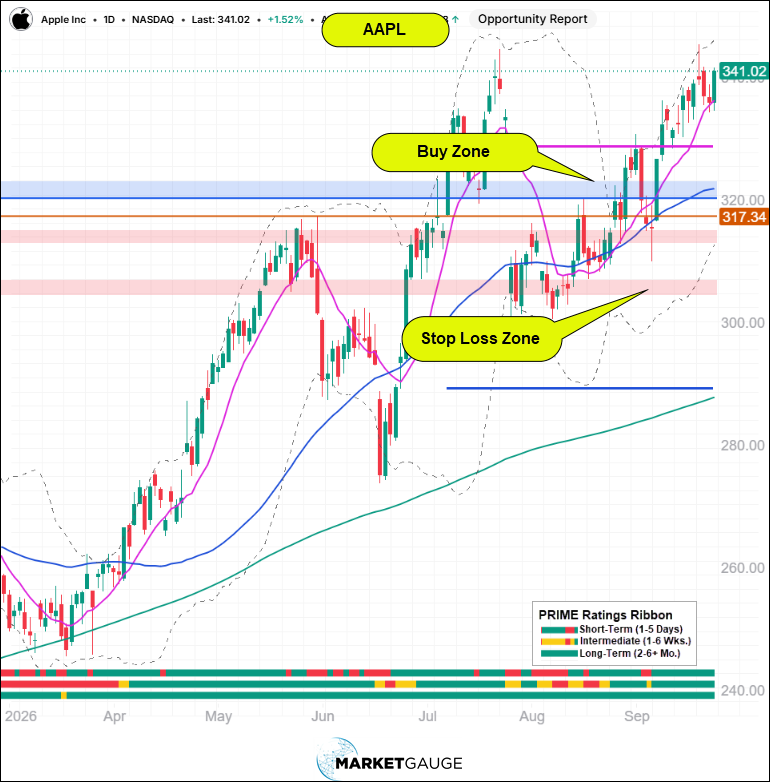
The chart below suggests that AAPL is doing just fine, and we have it as a holding in our Opportunity Report, but there is a huge opportunity it's squandering or worse - risking its future by not acting on it.
For an interactive chart on AAPL click here
On September 9th, META gapped higher on news that it had released a new AI app called Muse. The stock has rallied more than 20% since the announcement, as the adoption of the app has been extraordinary.
Tech commentators will call it your AI agent and wildly describe how it can automate a lot of things in your life very easily.
In some respects, the hype is not wrong, but another perspective is that it’s just an app that’s doing what AI has been able to do for at least a year, but with tools that are less user-friendly.
Muse has made using an AI agent easy in the same way that ChatGPT made using AI prompting easy.
The importance of the Muse announcement for investors is how much the stock moved based on a modest demonstration of how easily adopted and potentially productive AI can be. Just a few months ago, software stocks were getting crushed because AI was going to destroy the software industry,
META is one of several software stocks that have enjoyed big gains on the narrative that they can show how AI will boost productivity, be widely adopted, and, as a result, generate positive ROI.
The ROI doesn’t necessarily need to be demonstrated yet.
Another similar example is MSFT, which exploded higher on Friday after it announced it would essentially improve its AI app, Copilot.
Copilot should have given Microsoft a huge head start in the AI race years ago, but it turned out to be a big, ineffective AI disappointment and contributed to the selloff in MSFT shares last year.
Now, with an announcement that they are reconfiguring copilot in ways that have made OpenAI and Anthropic so successful, the stock could (and should) catch fire if they can demonstrate traction with users.
Years ago, AAPL announced that Siri would become your personal AI-powered agent capable of incredible automations and integration between applications on and off the phone.
The stock soared on the announcement, but Siri never improved. In fact, compared to current AI capabilities, Siri is remarkably worse than it was a few years ago.
META just demonstrated that an AI agent, Muse, that users believe will make their life easier will become widely adopted in record time. Wall Street sees the potential ROI and has rewarded the stock.
AI is no longer a mysterious thing in the future. The workplace requires you to learn it; consumers are adopting it; new college grads have been using it for years; tech advancements have made it incredibly easy to use for what was once very sophisticated tasks.
Microsoft still has an opportunity to enable Copilot to leverage the unusual advantage of its massive captive install base. I hope and believe they will, and the stock will be rewarded for it.
Muse is a “wake-up AAPL” moment. AAPL is running out of time with Siri.
Siri should be the most widely used and technologically superior AI-driven consumer application, but if it doesn’t achieve a major leap forward soon, it’s going to go the way of the BlackBerry keyboard - people look back on it fondly, but they don’t own it now.
The good news for AAPL investors is that if AAPL demonstrates a willingness and ability to make Siri a leader in AI, the stock hasn't priced that in yet.
It’s a catalyst worth being on the lookout for, and even a reason to own the stock, hoping for it, but don’t hold your breath while you wait.
Want More MarketGauge?
If you’re an individual investor or an advisor, and would like help navigating the everchanging dominant themes in the market with strategies, tools, automated trading systems or professional advisory services, contact us:
Best wishes for your trading,
Geoff Bysshe
Co-Founder
(Connect on LinkedIn)
 |
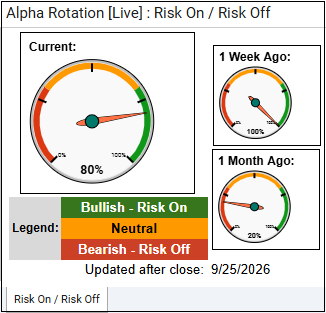 Every week we review the big picture of the market's technical condition as seen through the lens of our Big View data charts. Every week we review the big picture of the market's technical condition as seen through the lens of our Big View data charts.
The bullets provide a quick summary organized by conditions we see as being risk-on, risk-off, or neutral. The video analysis dives deeper. |
Summary: The market remains broadly risk-on, led by strong technology and semiconductor performance, positive QQQ volume trends, low volatility, supportive risk gauges, and strength in growth and emerging markets. However, weak breadth beneath the surface remains a concern, with deteriorating market internals, weak participation in SPY, DIA and IWM, fewer stocks holding key moving averages, and sharply rising rates creating an increasingly important counterweight to the strength in large-cap technology.
Risk On
Neutral
Risk Off
Maintain a risk-on bias, but stay selective and avoid chasing broad-market strength given the continued deterioration in breadth. Favor leadership areas—particularly technology, semiconductors, select healthcare, and stronger emerging markets—while keeping position sizes disciplined and using pullbacks or consolidations as preferred entry points.
Continue to underweight or avoid weaker areas such as small caps, retail, and transportation until they demonstrate improving momentum and participation; oversold conditions could produce tactical mean-reversion trades, but they have not yet established durable leadership. Closely monitor market internals, new highs versus new lows, and the percentage of stocks above key moving averages—improvement would support increasing exposure, while further deterioration alongside weakness in QQQ would be a signal to reduce risk.
Keep stops tighter than normal given the sharp rise in rates and weak volume patterns outside the Nasdaq. Take partial profits into extended moves, particularly in technology and other momentum leaders, and watch gold for a potential failed breakout while allowing commodity positions with intact momentum room to consolidate.
Bottom line: Stay invested with a growth and technology bias, but don't confuse strong index performance with broad market health. Add exposure if breadth begins confirming the Nasdaq's strength; reduce exposure and raise cash if technology leadership breaks while breadth and market internals continue deteriorating.

Every week you'll gain actionable insight with: