October 18, 2026
Weekly Market Outlook
By Geoff Bysshe
Last week ended with SMH closing down for a 9th consecutive day. On paper, this bearish streak is its longest in 25 years, but as we’ll see below, it may not be as bearish as many think.
This streak got far more attention than the very unusual 7-day streak of synchronous higher closes in both TLT and USO. In the past 20 years, not only has this never happened; the next closest synchronous bullish streak was 4 days in 2020.
The chart below illustrates the relationship between TLT (long bonds) and USO (crude oil) from a few different perspectives.
The other very notable trend is the sub-chart showing TLT’s consecutive closes in either direction.
It’s noteworthy that the time period of the chart begins just before the war with Iran began. This highlights how much this intermarket relationship has changed in recent weeks, and as we’ll discuss later, it’s probably not a positive indication for stocks.
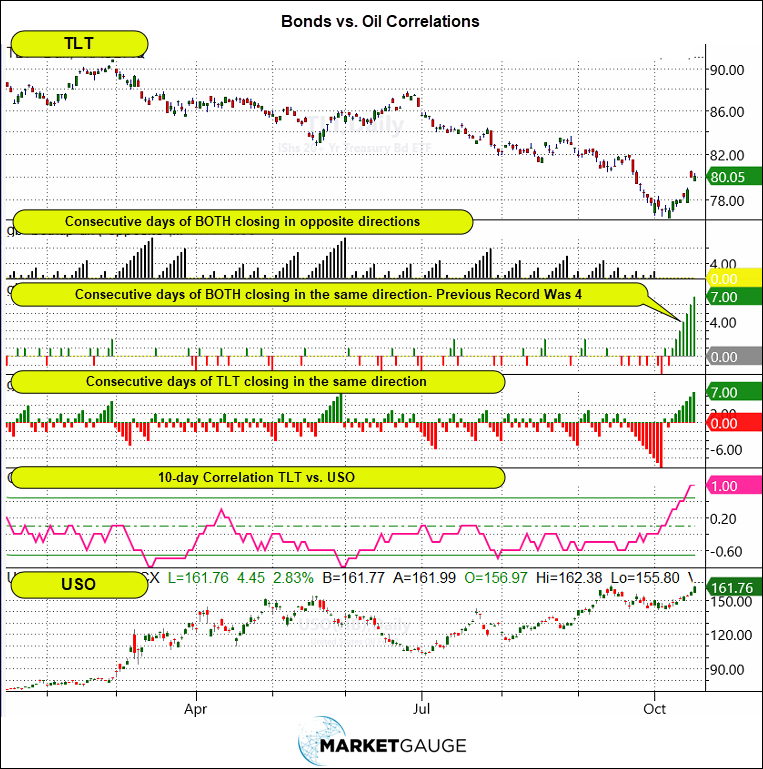
What makes the move up in bonds, along with high crude prices, even more alarming is that last week's CPI and PPI reports both suggested inflation was hotter than expected.
Higher oil plus higher Inflation data doesn’t intuitively (or historically) lead to higher bond prices.
What’s going on? And what might this mean for stocks?
Before we figure out TLT and USO vs. stocks, let’s look at what going on with SMH vs the whole market.
The Most Bearish Daily Streak in 25 Years. Oversold?
9 consecutive lower closes hasn’t happened in the SMH in 25 years, and it seems a little excessive.
However, if you want to use the SMH as an indicator, you may also want to focus on a few leading stocks to confirm your analysis.
Below you’ll see the chart of correlations between SMH and QQQ.
 |
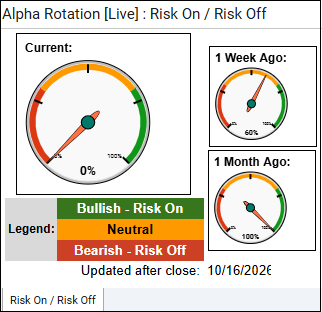 Every week we review the big picture of the market's technical condition as seen through the lens of our Big View data charts. The bullets provide a quick summary organized by conditions we see as being risk-on, risk-off, or neutral. The video analysis dives deeper. |
Summary: Despite a sharp market sell-off led by technology and semiconductors, improving market breadth, resilient internals, and strength in value-oriented sectors suggest that rotation may be playing a meaningful role alongside broader risk aversion. However, weakening momentum, heavy distribution, rising volatility, surging oil prices, and risk gauges shifting to 100% risk-off warrant a defensive stance until market conditions stabilize.
Risk On
Neutral
Risk Off
Maintain a defensive posture as weakening momentum, elevated volatility, and risk gauges at 100% risk-off suggest continued downside risk. Reduce exposure to vulnerable growth and technology positions, particularly semiconductors, while avoiding aggressive new entries until selling pressure subsides. Look for selective opportunities in areas showing relative strength, including energy, healthcare, retail, and value-oriented stocks, but keep position sizes modest and stops disciplined. Monitor improving market breadth and internals for signs that the recent sell-off is more rotational than systemic, while watching oil prices, bond yields, and the dollar for additional pressure on equities. A sustained improvement in price action, volatility, and risk gauges would support gradually increasing exposure, but for now prioritize capital preservation, maintain higher cash reserves, and remain patient for clearer confirmation of a market recovery.

Every week you'll gain actionable insight with: