October 26, 2026
Weekly Market Outlook
By Geoff Bysshe

Over the last two weeks, the market narrative behind the most influential sector (semiconductors, SMH) in the AI driven bull market has shifted significantly.
This week's earnings reports from AAPL, GOOGL, and MSFT are likely to add fuel to volatility in both the narrative and related equity prices.
For tactical active investors, this is an important time to avoid making the mistake of letting the “why” blind you from the “what” in your assessment of the market.
The “why” is the argument(s) for why the market is moving, while the “what” is an objective assessment of what the market is really doing.
Don’t let any explanations of “why” in this article get in the way of the “what” descriptions.
Here’s what’s happening plain and simple:
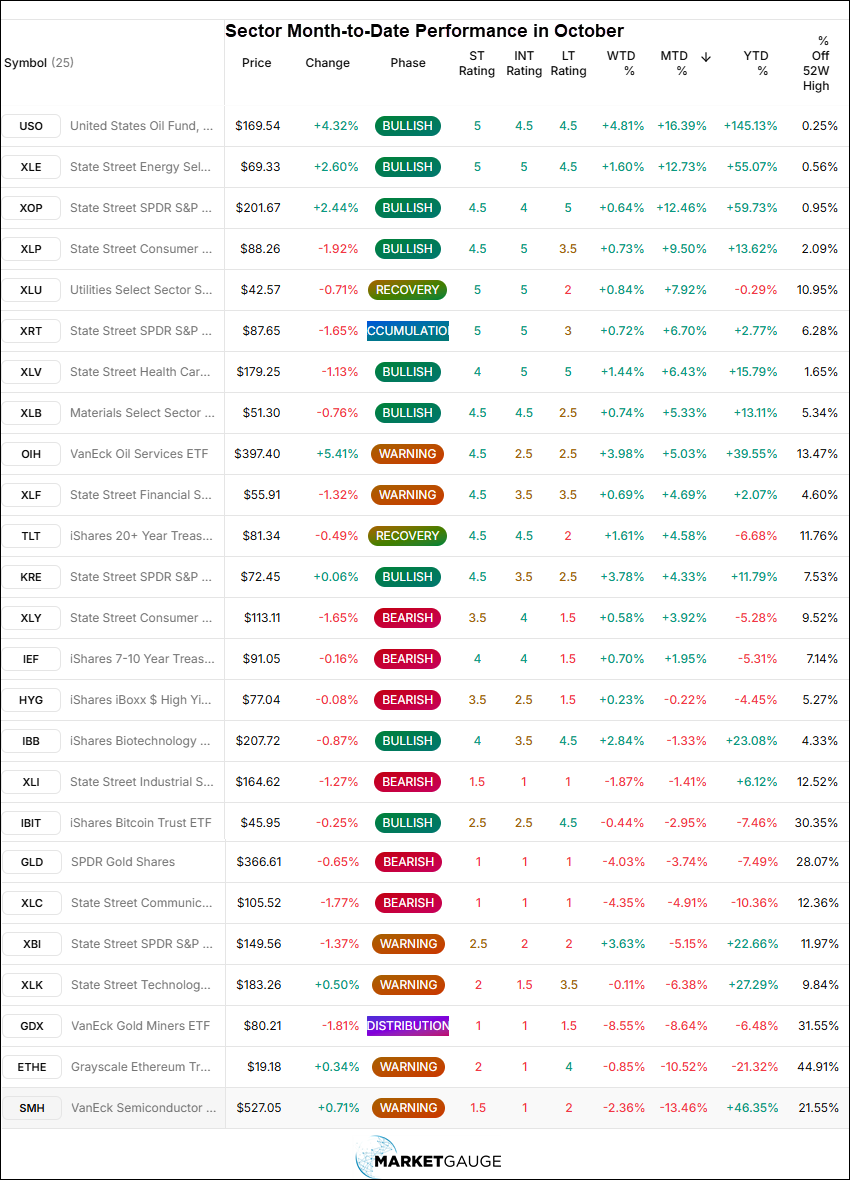
The list of conditions concerning for the bulls could be longer, but when the most influential market sector is the worst monthly performer, rolling over on the charts, and its growth story is increasingly under attack, you don’t need a longer list to make a bearish case.
Is The Semiconductor Selloff Really That Bearish For The Whole Market?
The short answer is, maybe.
Let’s frame the three bearish conditions above in the context of the broader market and over a multi-year time frame. From this perspective, the current correction is normal, and the market’s reaction is not only healthy, but it’s also creating new bullish opportunities.
A Very Bearish Month With Perspective
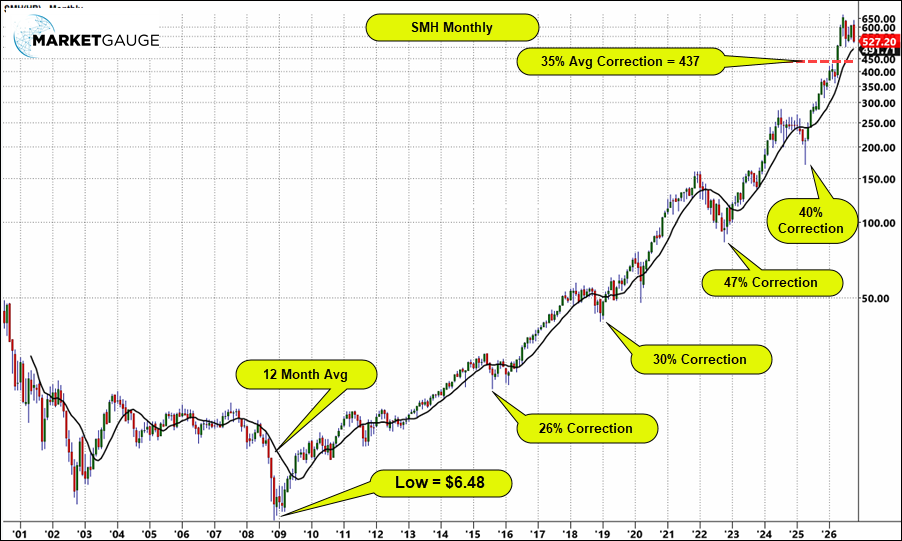
The SMH selloff has been uncomfortable, but in the context of historical corrections since the 2009 lows, it’s well within the definition of normal. See the chart below and consider the trend and location of the 12-month moving average and the size of prior corrections.
What’s So Bearish About The SMH Chart
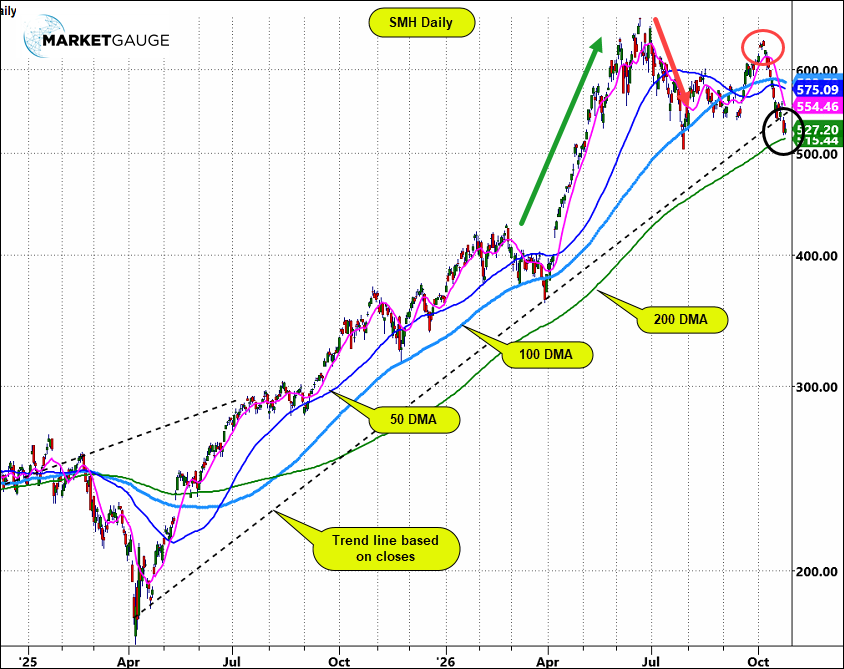
The long-term chart above is a trend that is still very much intact, but the short- term chart has a bearish pattern and it’s now sitting on its 200-day moving average and its important swing low from July.
The particularly bearish condition is the sequence of a large, steep rally labeled by the green arrow that was abruptly followed by the steep decline, which was followed by an attempt to rally to new highs that ended unsuccessfully with a second abrupt steep decline back to the initial decline’s swing low. If this low is taken out, this sequence forms a top that typically takes time to recover from.
The fact that the July swing low coincides with the 200-day avg., a break of the closing trendline from the low of 2026 in April, and a big round number of $500 all adds up to the 500 level being a critical inflection point.
A more detailed trend analysis from our MarketGauge PRIME analysis indicators (below) shows how weak the trend is on time frames. This suggests that if the 500 level breaks we should expect more downside.
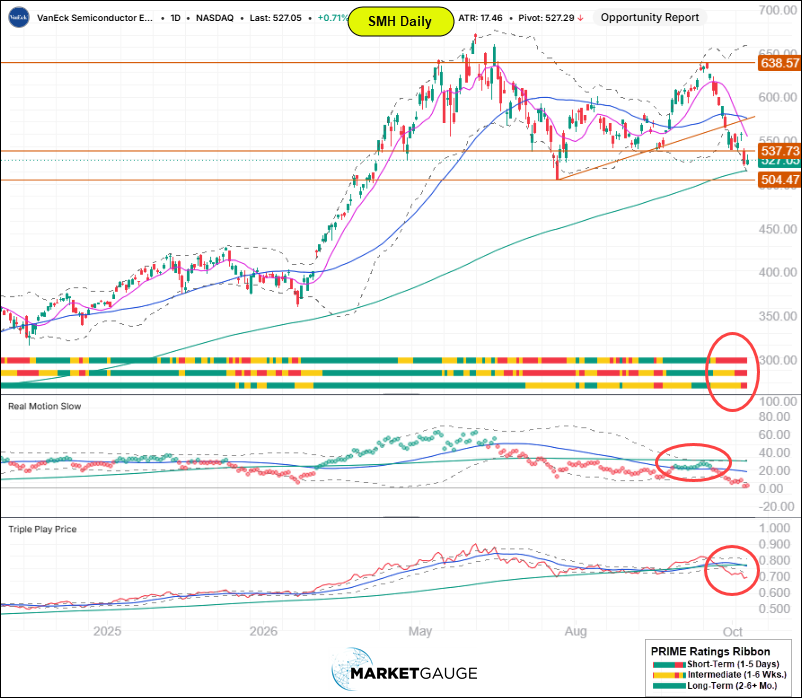
Click here for the SMH daily chart live
Will Earnings Season and The Strong EPS Growth Prevent Further Declines?
The new more discerning market narrative in the SMH sell-off is that companies are overspending, ROI expectations are overdone, and AI will disappoint on productivity gains.
We can debate whether or not these predictions will come to pass, but we don’t need to debate what investors are doing – they’re not paying for growth in the way they did 6 months ago.
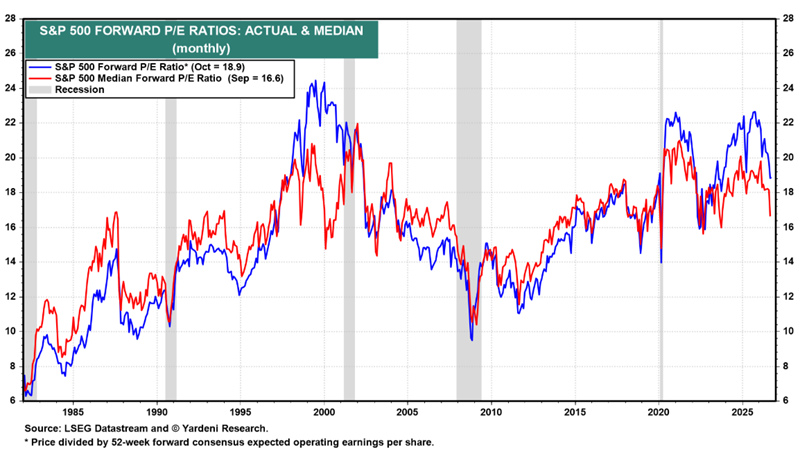
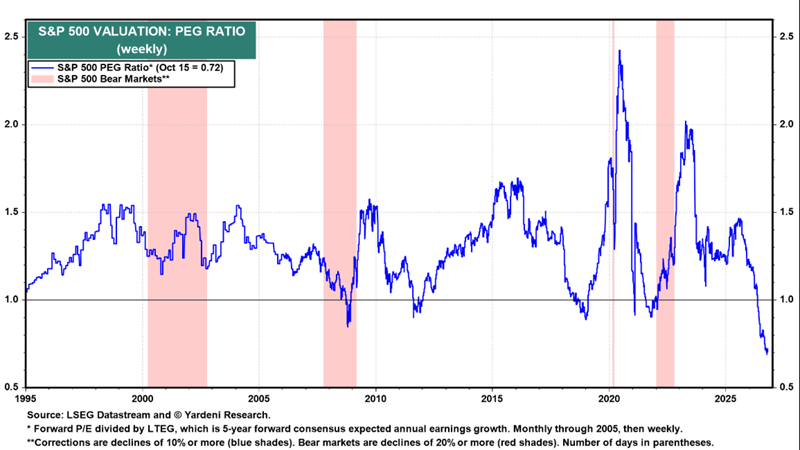
The charts of fundamental measures (PE and PEG) below might be interpreted as suggesting the market is not expensive or even a bargain at these prices. However, there is another way to interpret what’s happening here.
The pullback in PE in 2026 in the chart below also represents earnings rising without a commensurate move up in price; it is also occurring as 10-year rates rose rapidly. Higher rates are historically a dampening effect on PE.
Another perspective on investors’ valuation sentiment for growth is illustrated by the PEG ratio chart below. The PEG ratio shows what PE valuation investors are willing to pay for the current level of expected growth. A lower number suggests investors are less willing to pay a higher PE for the same level of growth.
Normally, a lower PEG is interpreted as better “value,” but it can also reflect investor sentiment that they don’t believe the expected growth will materialize or simply aren’t willing to pay more for it. Value isn’t always bullish.
Last week META reported better than expected earnings and revenues, but the stock sold off. This is an example of investors selling into good growth numbers.
The Good News For Semiconductors
The good news about the increasing bearish sentiment around AI growth as it relates to technology is that this process is normal. As a new technology rolls out, investors shift expectations from seeing every company as a potential winner to being more selective.
If the new technology is real, the next wave of new market leaders emerges, and the bull market continues after the shakeout of the weaker companies and stocks.
The Good News For The Bull Market
Looking back up at the sector performance table for the month of October, you’ll see several sectors (ex-energy) have been strong.
As we’ve covered in recent Market Outlook weeks, market breadth, as represented by the equal-weighted S&P 500, has been improving despite weakness in SMH.
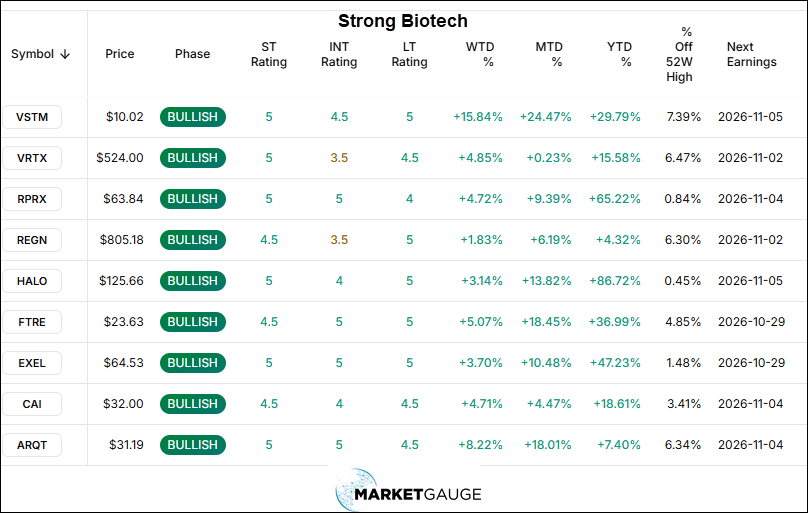
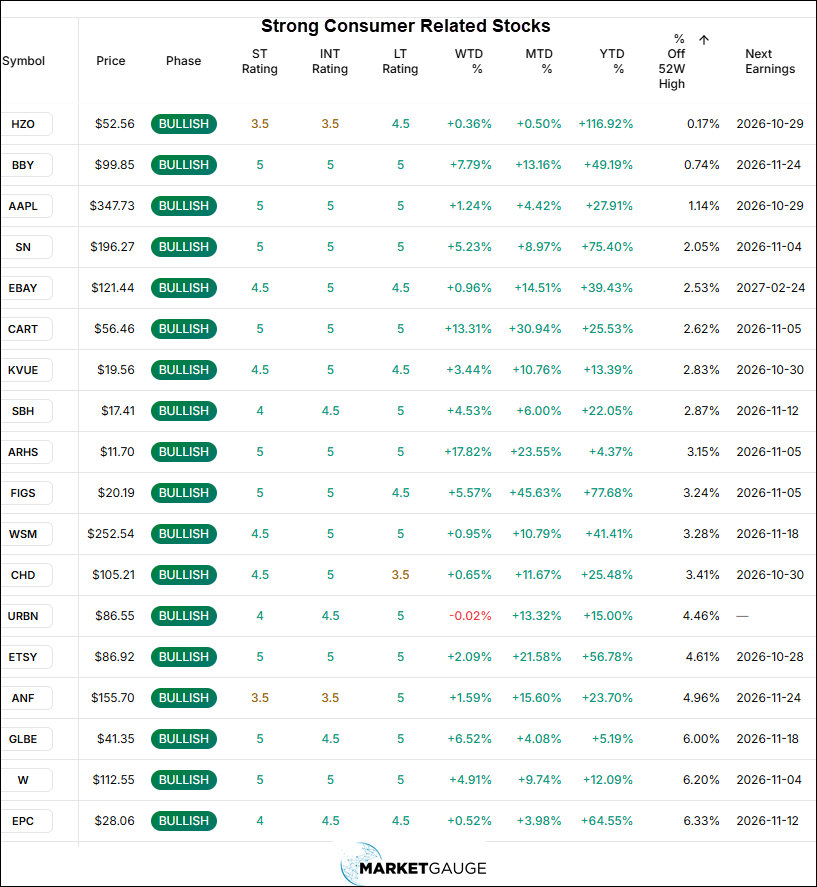
Below you’ll find tables of stocks that represent highly rated stocks based on MarketGauge short-,intermediate-, and long term PRIME factors and that are near 52-week highs within several sectors that have performed well in October.
Biotech is a big beneficiary of AI
Consumers are spending.
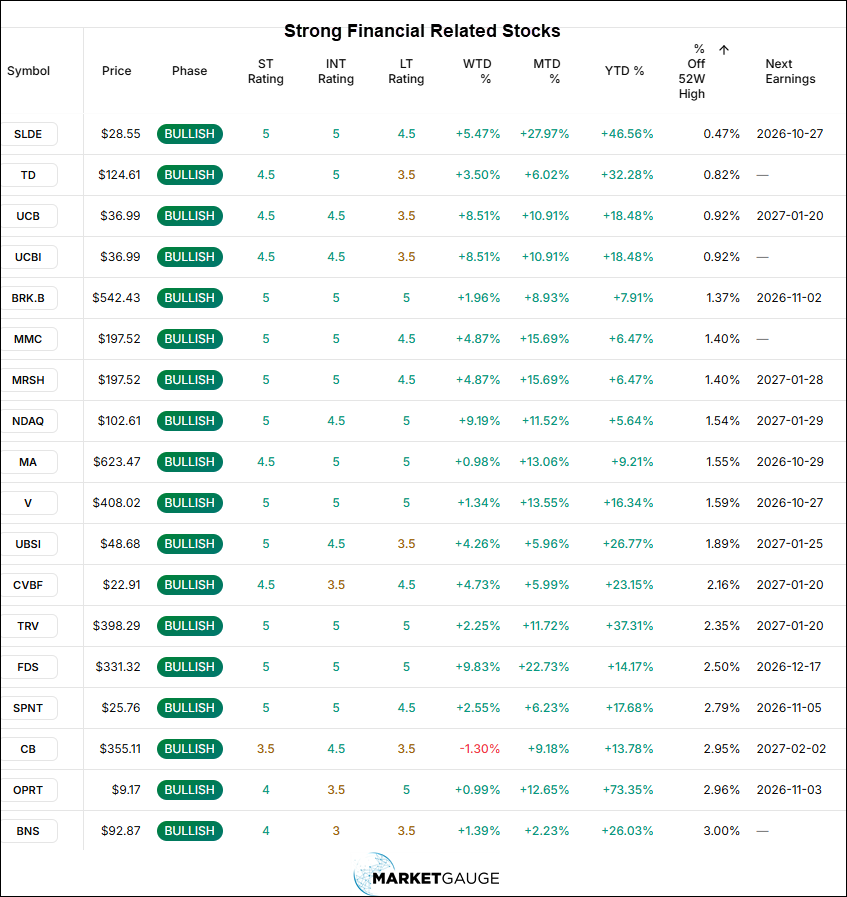
Healthcare can do well on defense and offense
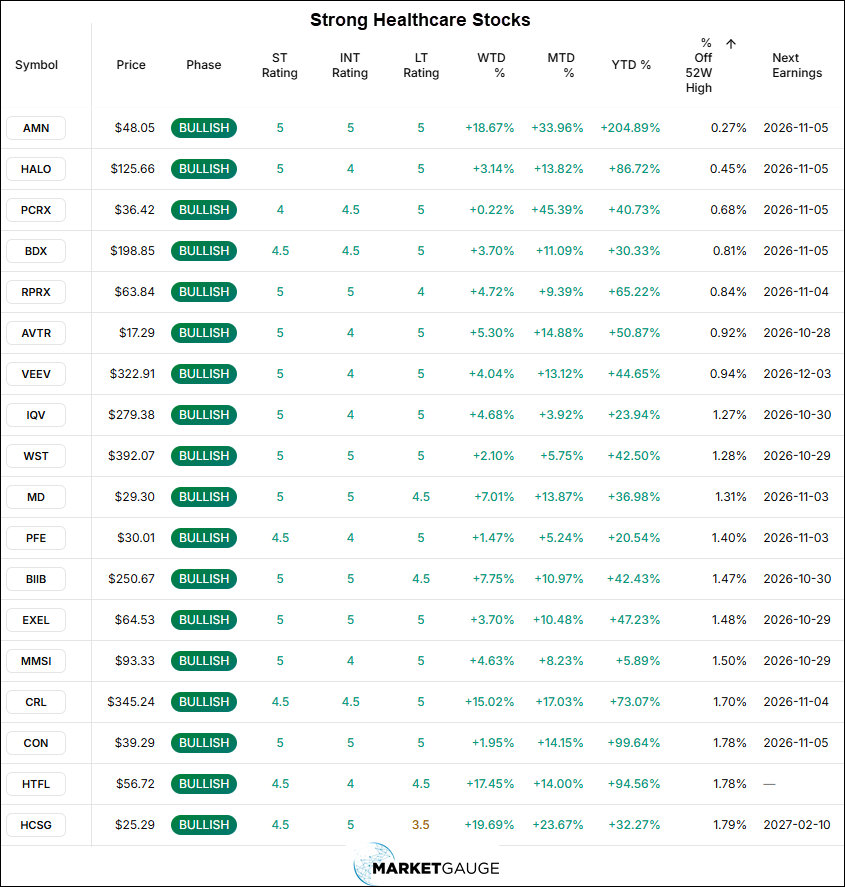
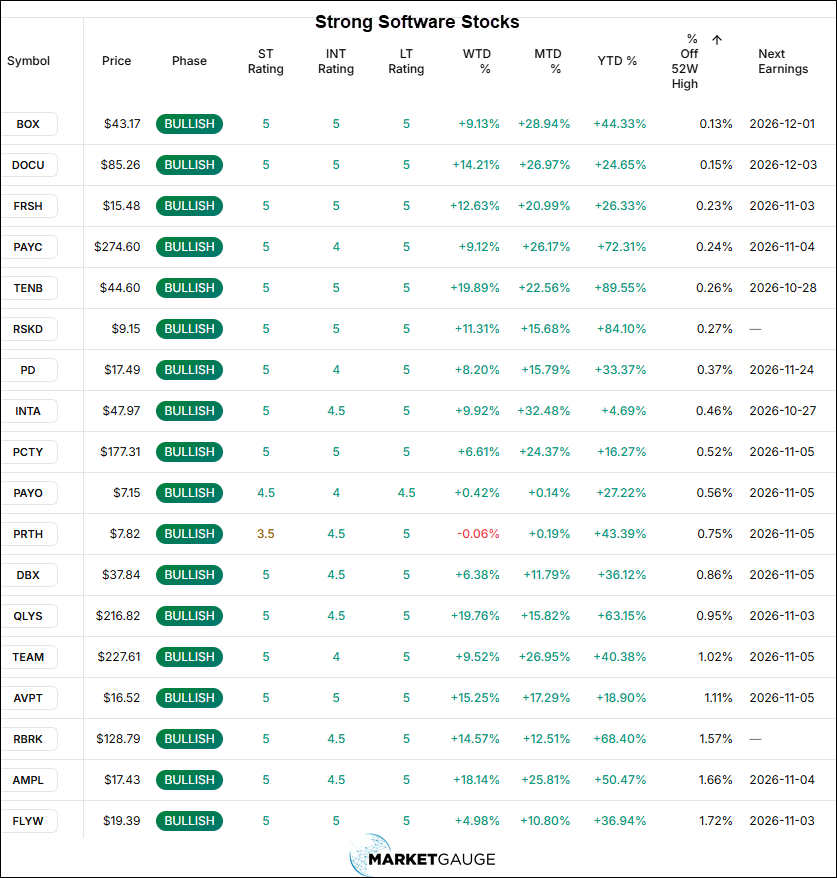
If we keep seeing strong stocks like these while the SMH corrects, the bull market is not broken; it’s more selective.
Keep your eye on what the market is doing. If the market is rotating into new leading areas, then don’t let the bearish commentary about why one area of the market is turning bearish distract you from an objective assessment of what the bigger market narrative is saying about the likely direction of the bull market.
Want More MarketGauge?
If you’re an individual investor or an advisor, and would like help navigating the ever-changing dominant themes in the market with strategies, tools, automated trading systems or professional advisory services, contact us:
Best wishes for your trading,
Geoff Bysshe
Co-Founder
(Connect on LinkedIn)
 |
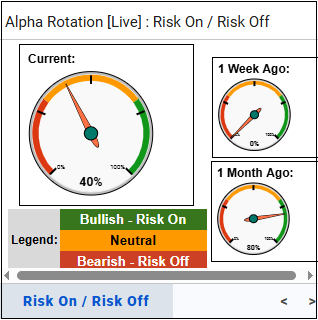 Every week we review the big picture of the market's technical condition as seen through the lens of our Big View data charts. The bullets provide a quick summary organized by conditions we see as being risk-on, risk-off, or neutral. The video analysis dives deeper. |
Summary: Market conditions showed signs of improvement as strengthening breadth, broad sector participation, and a recovery in risk gauges suggest a potential rotation toward value and economically sensitive sectors, supported by a rebound in bonds and declining yields. However, major indexes remain below key moving averages, while persistent distribution, elevated volatility, semiconductor weakness, and rising oil prices continue to warrant caution despite the improving underlying market internals.
Risk On
Neutral
Risk Off
Maintain a cautious but increasingly opportunistic stance as improving market breadth, stronger sector participation, and recovering risk gauges suggest a potential foundation for a broader market rebound. Focus on selective opportunities in areas showing relative strength, particularly regional banks, homebuilders, small caps, and value-oriented stocks, while keeping position sizes modest until major indexes reclaim their 50-Day Moving Averages. Remain defensive toward growth and technology, especially semiconductors, which are testing critical support near their 200-Day Moving Average. Monitor volatility, distribution patterns, and oil prices for signs of renewed selling pressure, while watching whether the bond market's recovery can provide additional support for equities. Gradually increase exposure as price action and risk gauges confirm improving conditions, but prioritize capital preservation and disciplined risk management until a more sustainable uptrend emerges.
**There will not be a video this week

Every week you'll gain actionable insight with: