September 6, 2026
Weekly Market Outlook
By Geoff Bysshe
While over the last several months, as the market has been coming to grips with likelihood of a higher Fed Funds rate and the reality of higher long-term rates, the ETF for the Mag 7 has been improving its technical condition.
On Thursday, MAGS broke out of a multi-month consolidation. The breakout didn’t hit all-time highs, but the pattern is capable of sending the chart much higher than the current all-time high.
Friday’s retracement is not the follow though the bulls would have liked to see, but the technical condition as represented by the MarketGauge’s PRIME Ratings shown in the chart below are as strong as they’ve been since 2025.
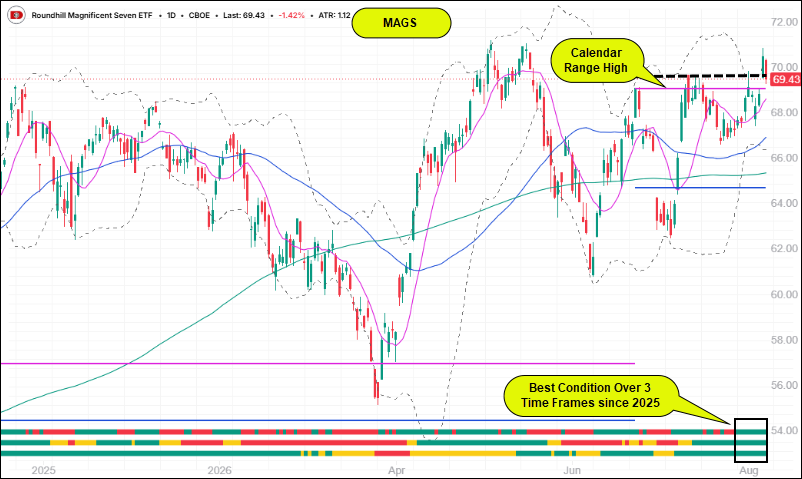
Click here to get an interactive chart of MAGS
Looking Under The Hood of MAGS
All of the Mag 7 have a big part in the AI transformation, but in quite different ways.
Additionally, in the past they have become a popular destination for investors during periods of tightening monetary policy.
The MAGS chart looks strong, however, when you look at look each component individually their charts are very different.
Starting with the numbers...
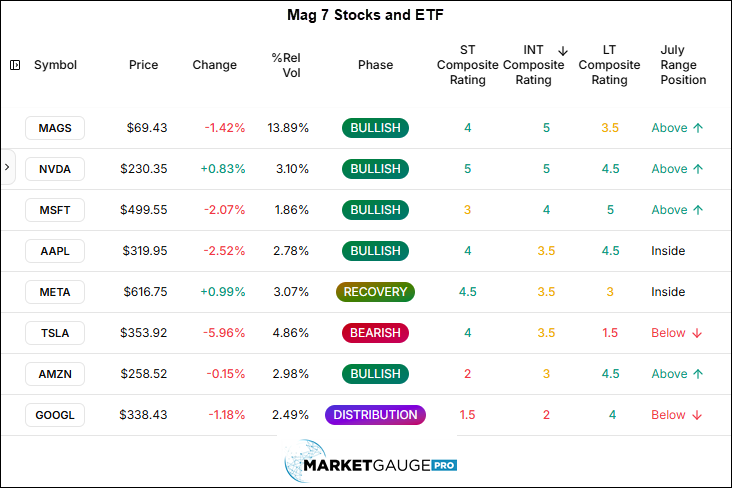
As you can see from the table above, their trends (Phases) range from bullish to bearish. The PRIME ratings vary widely, and their location relative to their July Calendar Ranges include both above and below.
NVDA
Nvidia spent August consolidating on top of another consolidation zone, and looks like it’s ready to run.
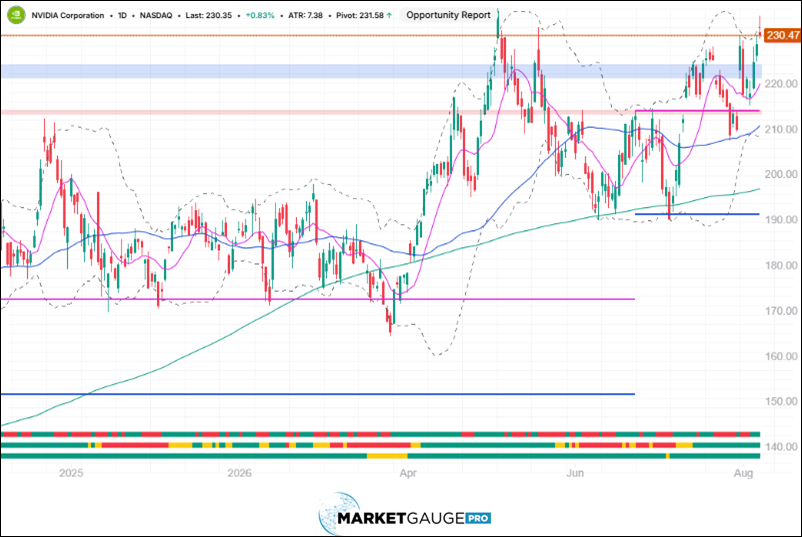
Click here for an interactive chart
MSFT
2026 was a rough year for MSFT until its latest earnings report recued it. The stock has continued to rally and sits about 10% below its all-time highs.
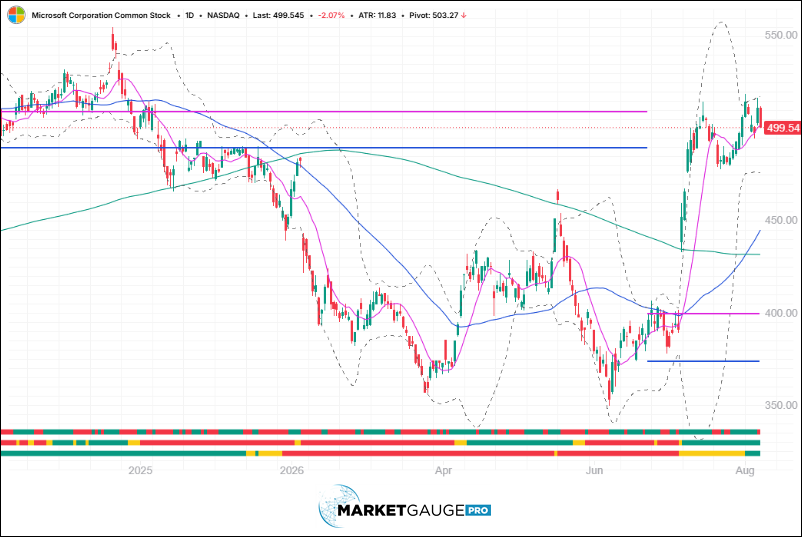
Click here for an interactive chart
AAPL
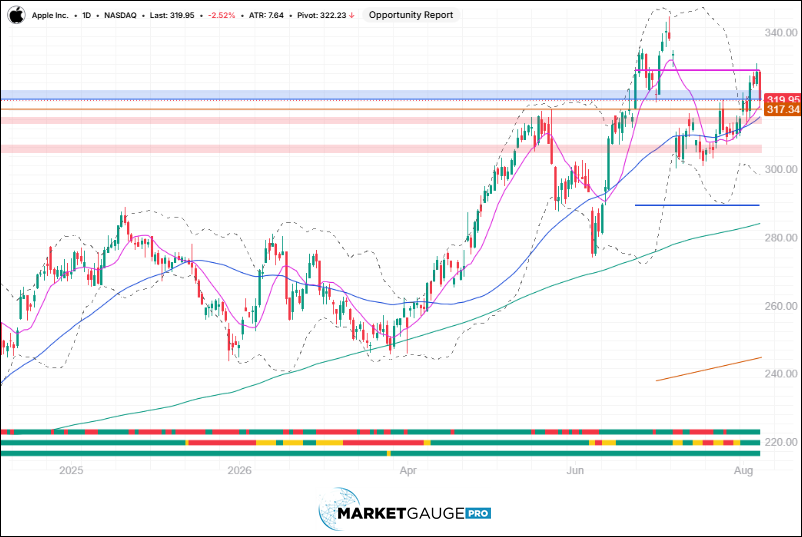
After gapping down in response to its earnings announcement it held firm at the 50 DMA and climbed back to the July Calendar Range high and the low of the day before it gapped down. If it can clear the calendar range high it will be in good shape to continue higher with it new CEO now at the helm.
Click to get an interactive chart
META
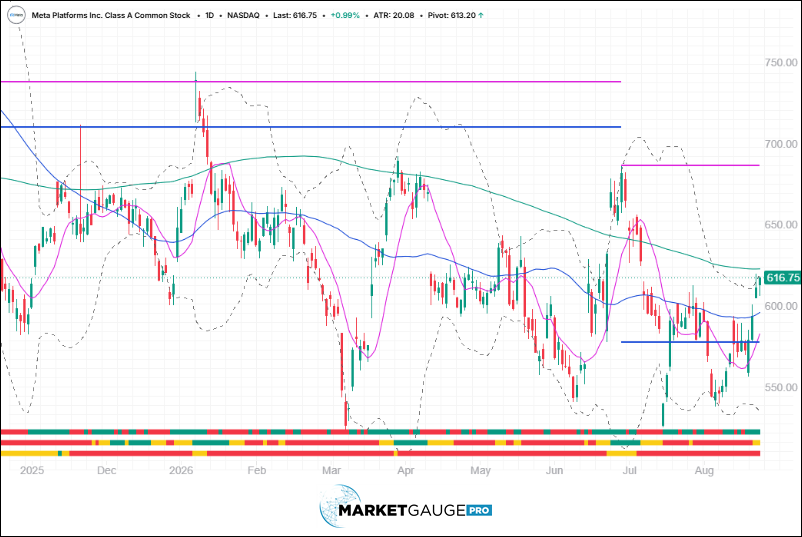
Meta has been in a strong bearish trend, not only in price but also in other PRIME factors as demonstrated by its bearish PRIME ribbon indicator. Until it demonstrates an ability to hold above the 200-day MA, it’s hard to count on it for upside. On the other hand, it has a strong base below it.
Click here for an interactive chart
TSLA
Click here for an interactive chart
AMZN
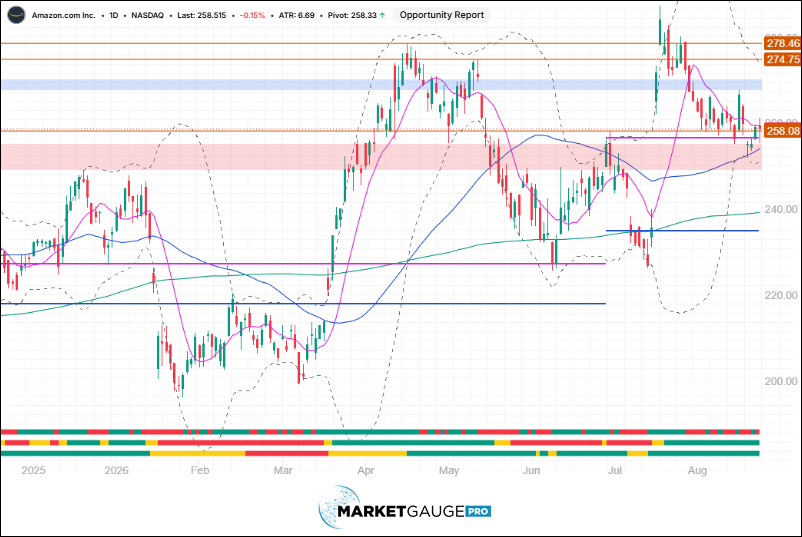
PRIME indicators suggest the dip is one to buy if it rallies over $267
Click here for an interactive chart
GOOGL
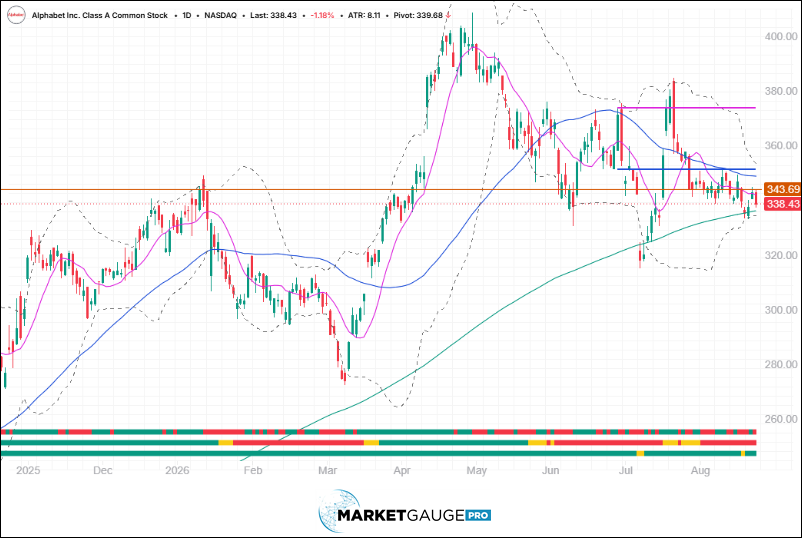
It’s compressing between 200-day MA support and Calendar Range Low resistance.
Click here for an interactive chart
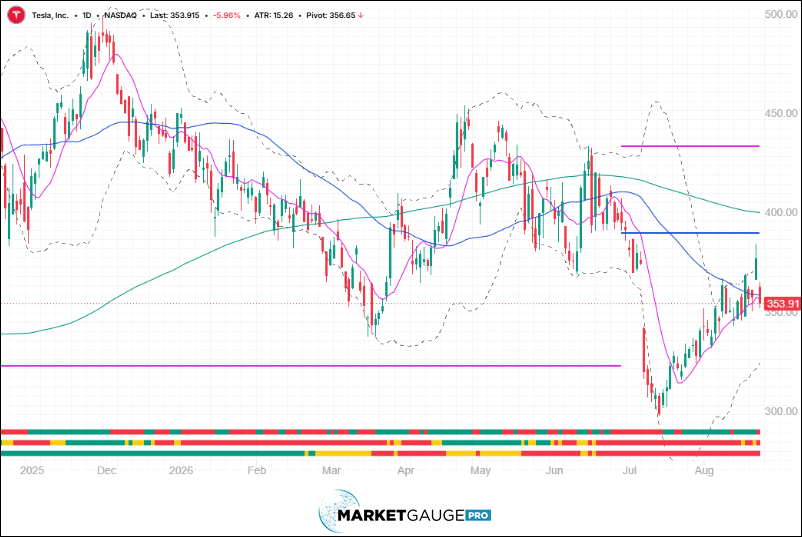
On balance NVDA, MSFT and AAPL look as good as MAGS, TSLA and META are still pretty bearish while AMZN, and GOOGLE could shape up quickly if they rally.
Keep an eye on these old favorites. They’re not going away.
If you'd like access to the MarketGauge indicators, strategies, automated trading models, and more, contact us.
Have a great week!
Geoff Bysshe
Co-Founder
MarketGauge.com
 |
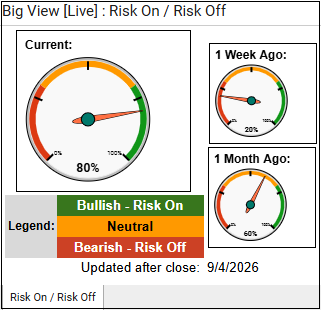 Every week we review the big picture of the market's technical condition as seen through the lens of our Big View data charts. Every week we review the big picture of the market's technical condition as seen through the lens of our Big View data charts.
The bullets provide a quick summary organized by conditions we see as being risk-on, risk-off, or neutral. The video analysis dives deeper. |
Summary: The overall picture remains cautiously risk-on, supported by bullish major-index phases, strong foreign equities, low volatility, improving risk gauges, and Bitcoin holding near its highs. However, weakening breadth and market internals, deteriorating Modern Family participation, bond-market pressure, and unfavorable September seasonality argue for selective equity exposure rather than aggressively adding risk.
Risk On
Neutral
Risk Off
Maintain moderate equity exposure, but avoid aggressively adding risk while breadth, Real Motion, and market internals remain weak. Favor SPY, selective growth, emerging markets, semiconductors, and biotech; add only when price strength is confirmed by improving momentum and participation, while trimming consumer discretionary and other weakening positions. Keep stops tight, consider inexpensive hedges while volatility is low, avoid chasing overbought commodities, and treat a further deterioration in breadth or a break of key index support as a signal to reduce exposure and raise cash.

Every week you'll gain actionable insight with: