August 23, 2026
Weekly Market Outlook
By Geoff Bysshe

Summary
This week, most of the media’s attention will most likely be pointed towards the Fed's Jackson Hole meeting and Nvidia's earnings for good reasons, but the real fireworks may happen in a less popular sector.
First let’s give it some context.
The table below shows the market sectors with additional markets (crypto, bonds, oil, gold) ordered by their distance from their 52-week high.
One way to identify strong trends with the table is to look at the following columns – the trend Ratings (>3), July Range (above), Phase, Hit 10 Day High.
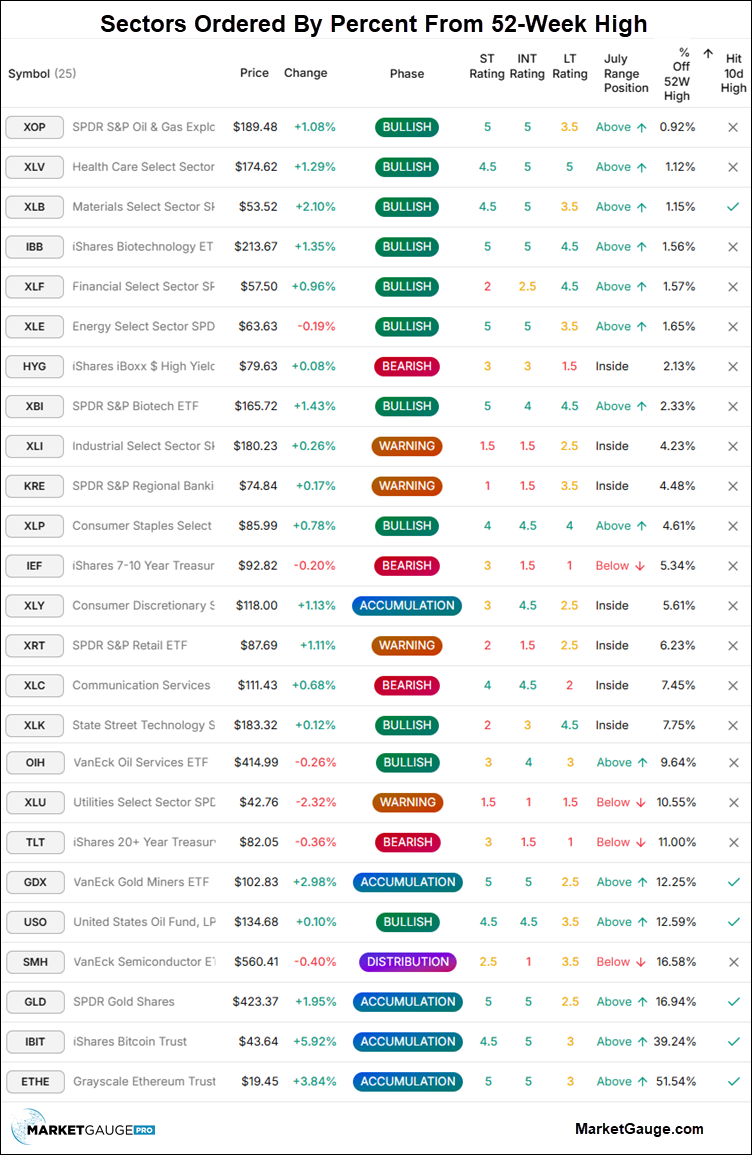
With the S&P down for the week, I wasn’t expecting to see XLB (Basic Materials) at the top of this list and hitting a new 10-day high which is also pennies away from the all-time high close in February.
XLB does have some exposure to gold, but that’s not why it’s so strong. When you look under the hood you’ll find broad strength in two economically sensitive industry groups.
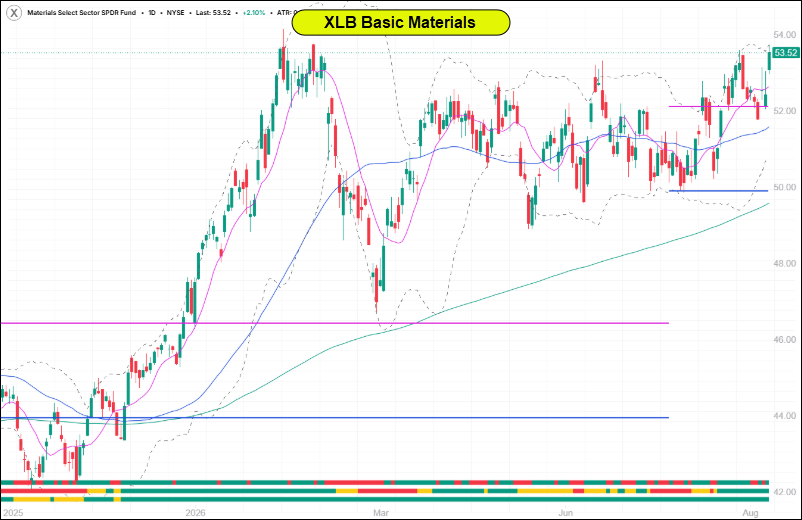
In addition to teasing its all-time closing highs, the chart has a very bullish breakout pattern. So what’s driving XLB, and which stocks offer the best trend-trading opportunities?
The chart below shows how on Friday XLB broke out of a consolidation that has been coiling since April just under its 52-week highs.
The PRIME Rating Ribbon shows a graphical representation of the short (top), intermediate, and long-term (bottom) ratings based on our PRIME framework for analyzing trend strength.
Below is a table of the stocks in the XLB. As with the sectors table above, the strongest trends can be identified by looking at the following columns – the trend Ratings (>3), July Range (above), Phase, Hit 10 Day High.
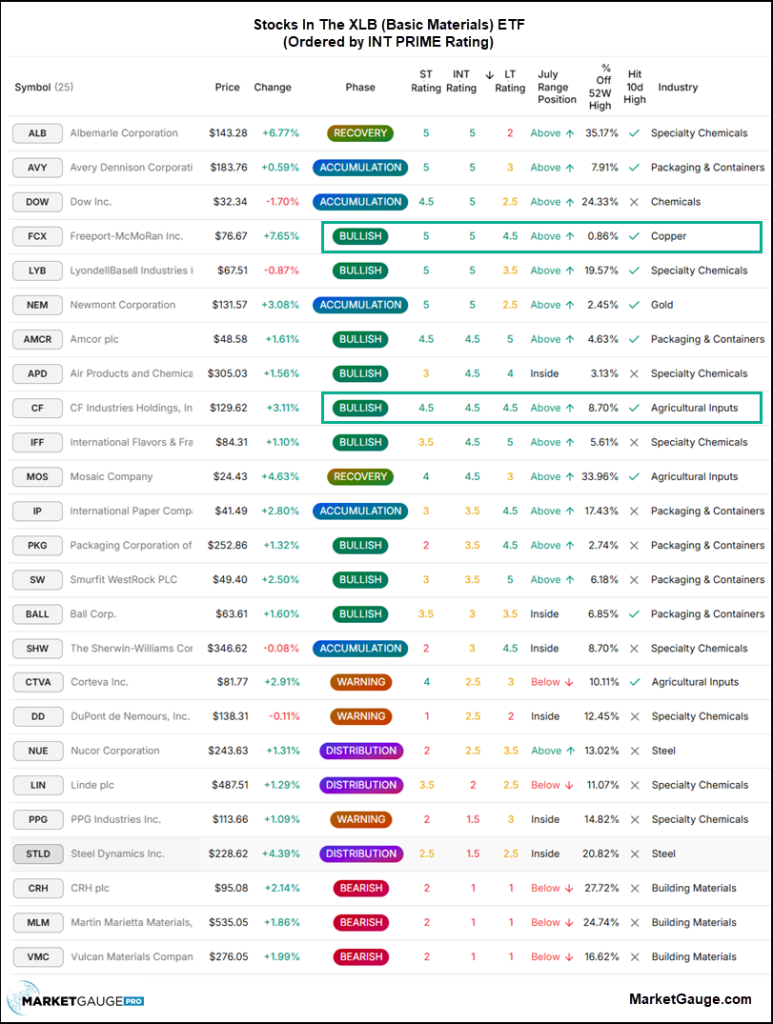
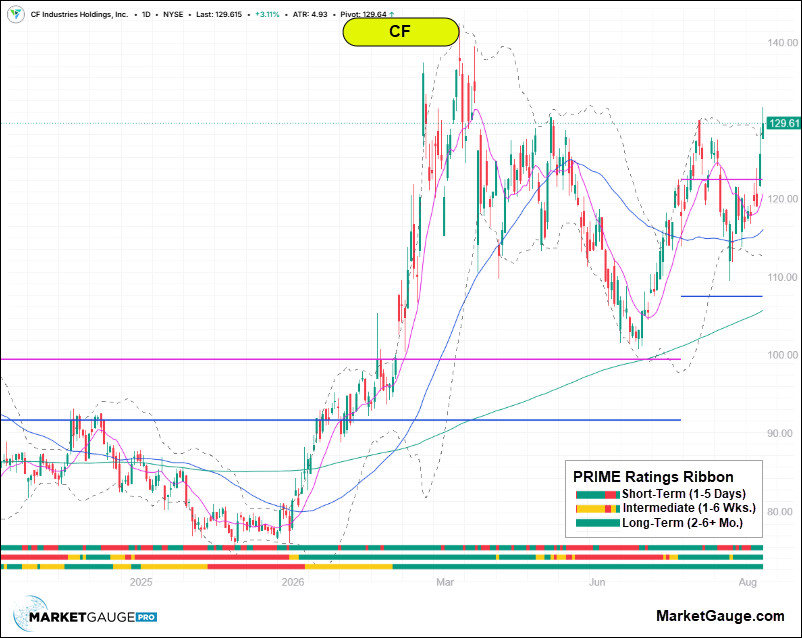
There are several good looking charts in the table above, but two that caught my attention were FCX, a leader in the copper industry, and CF a leader in fertilizer, and the agricultural inputs industry.
Both charts below are very bullish.
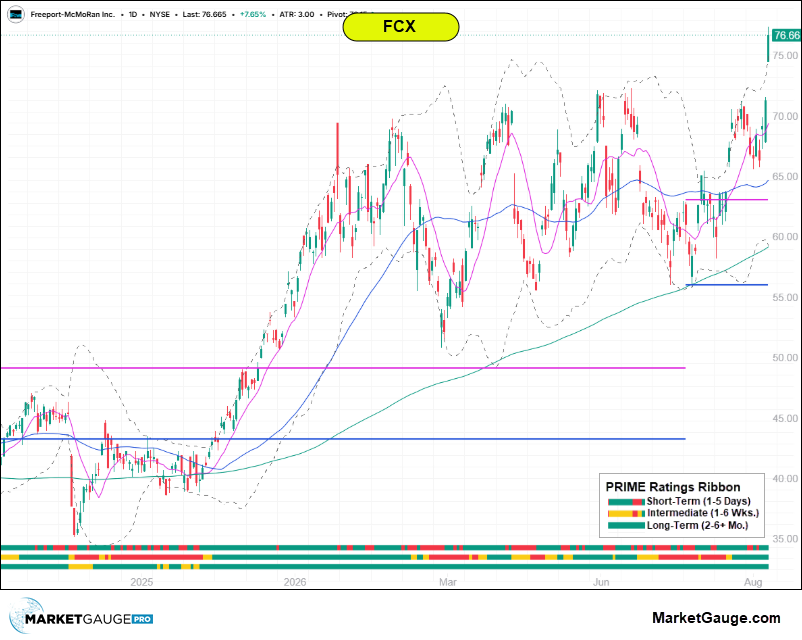
And these aren't isolated cases. As you can see in the table below, every stock in their respective industries hit a new 10-day high on Friday, despite very different long-term trends.
As you can see from the table below they ALL hit new 10-day highs on Friday regardless of their differences in their long-term trends.
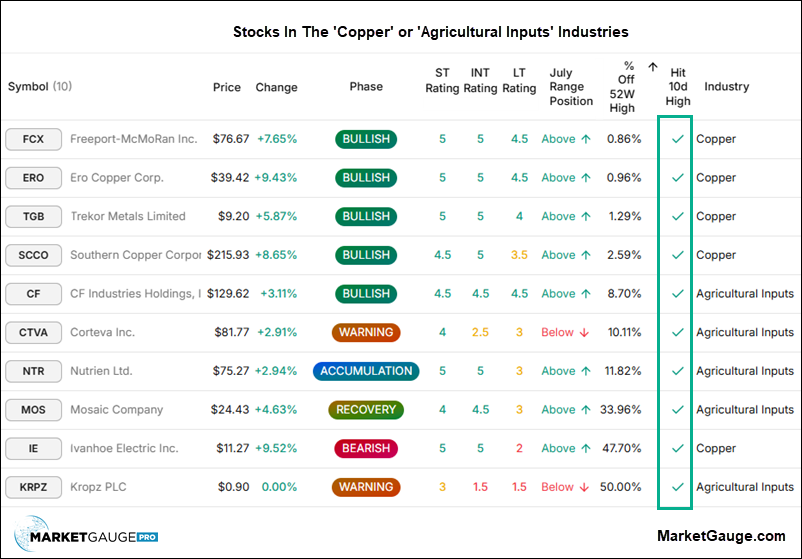
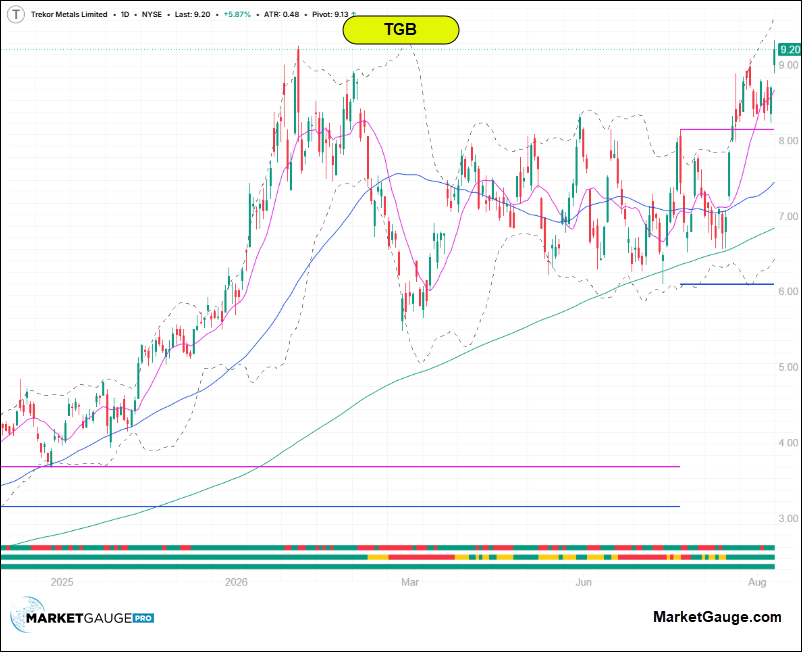
Every copper company in the table above has a bullish chart, including IE, which is 47% off its 52-week high.
If you like momentum, you may like the chart of TGB below.
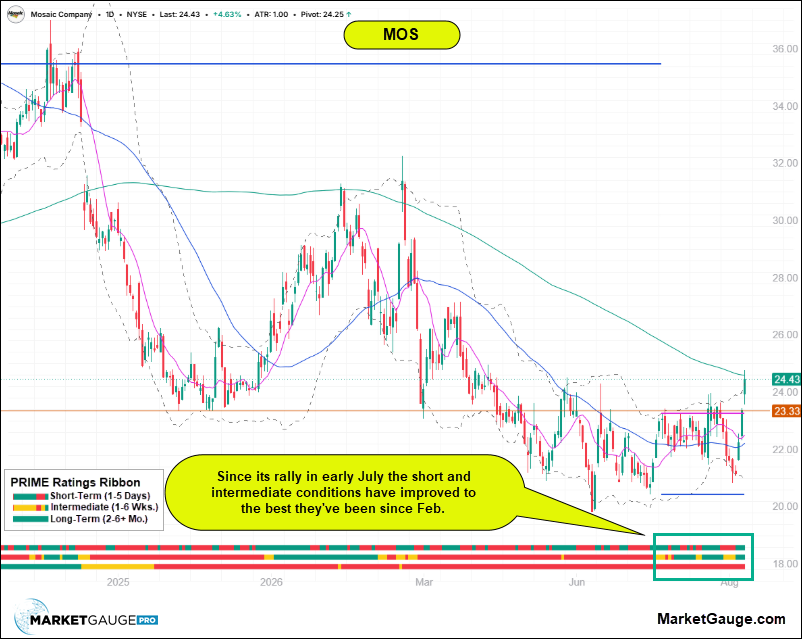
If you like stocks coming off lows, MOS has an interesting narrative.
MOS has posted y/y quarterly losses in 14 of its last 15 quarters!
Analysts are anticipating sales growth to return in the Dec 2026 quarter and profits to show up in the first quarter of 2027.
On the technical side, the daily chart below shows how its short and intermediate-term ratings have improved leading up to Friday’s breakout over its recent consolidation.
This breakout is significant in that it’s now decidedly back over the major pivot area of highlighted by the horizontal line at 23.33. If you look at a weekly chart (not shown here), you’ll find the major low at that level in late 2025 is second side of a double bottom that began in late 2024.
If MOS can get firmly over its 200 DMA, the market may be saying it believes the expected sales and earnings turnaround.
Why The Fed and The White House Should Watch XLB
The strength in the Materials sector, and especially broad strength in its sub-sectors, copper and agricultural inputs, is a strong statement by the market in that it’s pricing in a strong economy and continued inflation.
Depending on your point of view, this is a problem for bonds.
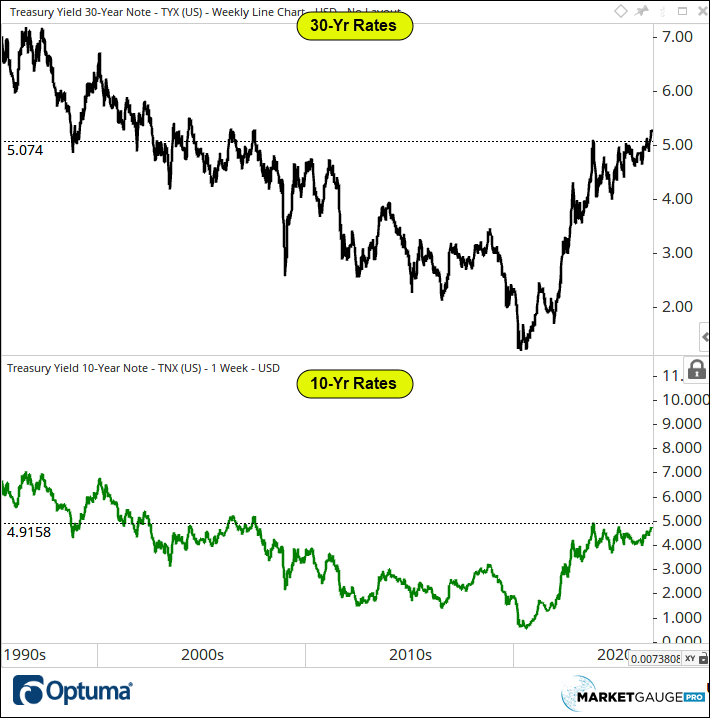
Last week Treasury Secretary Bessent tried to jawbone the bond market into reversing its persistent bearish trend (uptrend in rates).
Bessent may not be a chartist, but his extensive experience with trading and manipulating markets was most likely focused on the breakout you see in the pattern of the 30-year interest rates below.
Most importantly, he’s doing his best to prevent the 10-year rate, which is much more important for the economy and to the consumer, from experiencing the same breakout.
The Gold Rally Likes XLB Too, But There's A Bigger Story
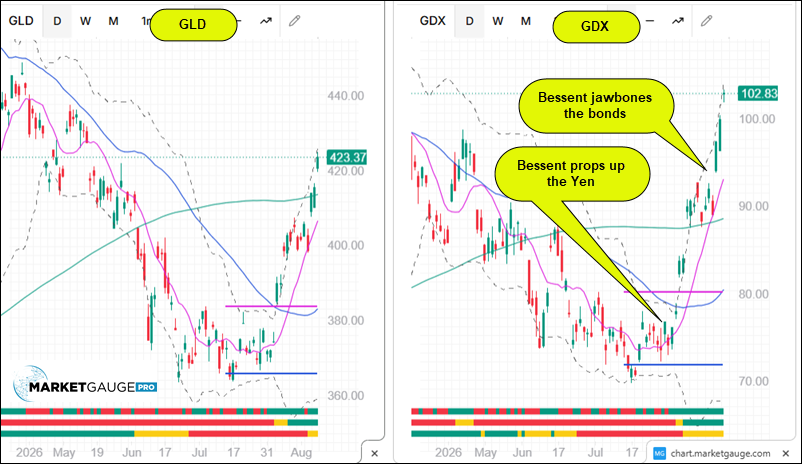
A couple weeks ago we highlighted the historic size of the move in gold and the GDX (Miners) ETF from their 2026 lows. What we didn’t highlight was that occurred immediately after Secretary Bessent was executing a coordinated effort with the Japanese to support, manipulate, prop up the Yen.
Last week, Bessent’s efforts to prop up the US long bond had the same effect on gold. The shiny metal and its miners shot higher as you can see in the charts below.
Lower interest rates are generally a positive tailwind for gold, but that’s not likely why gold responded so aggressively.
Even more so than an inflation hedge, gold will get stronger when there is a fear of instability in currencies or financial systems.
With a Fed Chair that has said that he wants to let the markets to provide the Fed with insight without his opinions moving the market, while at the same time the Treasury is blatantly trying to manipulate the markets, one thing is certain – it’s a bullish environment for gold without even factoring in inflation and fiscal deficits.
What To Watch During The Jackson Hole Event.
Much of the narrative will likely be around the changing expectations for a Fed hike or cut, but that won’t tell the same story as watching;
Don’t over think it. Be open-minded and watch what the markets have to say.
The simplest message is usually the right one.
Want More For Yourself or Your Clients?
Everyday from 9:00 - 10:30 I review the markets, demonstrate how to find and execute trades, and answer any questions to help you become a better active investor. I also learn a lot, and get lots of great ideas from the members in this live mentoring group!
For a limited time you can join us for free.
To get this special offer, Contact Rob Quinn, our head of member success here:
www.marketgauge.com/call
In addition, if you'd like access to the MarketGauge indicators, strategies, automated trading models, and more, contact us.
Have a great week!
Geoff Bysshe
Co-Founder
MarketGauge.com
 |
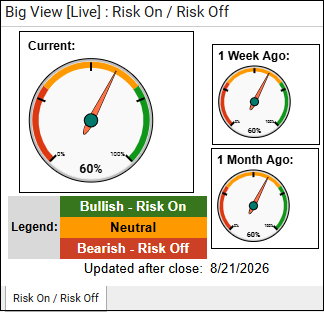 Every week we review the big picture of the market's technical condition as seen through the lens of our Big View data charts. Every week we review the big picture of the market's technical condition as seen through the lens of our Big View data charts.
The bullets provide a quick summary organized by conditions we see as being risk-on, risk-off, or neutral. The video analysis dives deeper. |
Summary
The primary bull trend remains intact, but the short-term condition changed materially this week. Last week’s broadly risk-on market narrowed into a rotational correction: all four major index ETFs declined over five days, QQQ moved into a Warning phase, and daily Real Motion weakened across the indexes. Semiconductors, technology, regional banks and industrials were the clearest pressure points. Friday’s rebound improved the close but did not reverse the week’s deterioration.
This is not yet a confirmed broad-market breakdown. SPY, IWM and DIA remain in Bullish phases, their longer-term weekly trends remain above rising moving averages, and the smoothed breadth readings are still constructive. Approximately 64% of S&P 500 stocks remain above their 50-day moving averages and 69% remain above their 200-day averages. Nasdaq breadth is weaker but not broken, with 53% above the 50-day and 67% above the 200-day.
The important development is leadership rotation rather than wholesale risk liquidation. Healthcare, biotechnology, energy, materials and gold miners gained while technology and economically sensitive groups weakened. At the same time, long-duration Treasury bonds remained bearish, the dollar weakened, and gold, oil and Bitcoin strengthened. That combination points more toward an inflation, fiscal-confidence and currency-debasement concern than an immediate recessionary collapse. High-yield credit spreads widened only modestly and remain relatively contained.
Risk On
Neutral
Risk Off
Current exposure
Move down one tactical exposure tier. A reasonable model posture is approximately 65%–75% of normal risk exposure, with 25%–35% held as dry powder or short-duration reserves. This refers to the percentage of a trader’s normal risk budget, not necessarily the percentage of the portfolio invested.
Do not move fully defensive while SPY, IWM and DIA remain in Bullish phases, weekly momentum remains positive and broad-market participation stays above its 50- and 200-day moving averages. However, do not maintain last week’s moderately aggressive posture while QQQ, SMH, KRE and XLI are in Warning phases and short-term internals are deteriorating.
Favored positioning
Areas to reduce or avoid
Add-risk confirmation
Increase exposure toward normal or moderately aggressive levels only when several of the following occur together:
Confirmation standard
A single strong day is insufficient. Price, Real Motion and participation should confirm one another.
Reduce-risk confirmation
Reduce exposure toward approximately 40%–50% of normal risk if:
Preferred Real Motion rule
Do not sell the first momentum break automatically. Wait for a failed rally, confirming Real Motion deterioration and a price-support violation.
Major regime-change trigger
A sustained break of the six-month calendar range, combined with weekly phase deterioration and a rollover in weekly Real Motion, would represent a much more important change than the current daily correction. That combination would justify a defensive posture, materially higher cash and broader hedging.
Gold and overbought Real Motion
For GLD and GDX, an overbought reading inside a narrow Real Motion band should be interpreted as:
Reduce or take profits only if the move produces a failed rally, Real Motion breaks its prior low or price violates meaningful support. Until then, use smaller positions, trailing stops and consolidation entries instead of trying to anticipate the exact top.
Event risk
Next week includes major technology earnings, the PCE inflation report and Jackson Hole commentary. Nvidia’s results are particularly important because QQQ and SMH are already technically vulnerable. Avoid carrying oversized new technology positions into these events unless the position has clearly defined risk.
Bottom Line
Stay invested, but no longer stay aggressive.
The long-term bull trend and broad-market breadth remain intact, while daily momentum, technology leadership, market internals and seasonality have weakened. Shift toward the areas where money is actually flowing, maintain meaningful dry powder, and require confirmation before adding back to technology. The base case is a rotational correction or consolidation, not a completed market top. The bullish case strengthens if QQQ and SMH repair their 50-day moving averages and Real Motion turns higher. The bearish case strengthens only if weakness spreads from technology into the broad indexes, breadth, credit and the six-month calendar ranges.

Every week you'll gain actionable insight with: