Clear Market Moves From A
Clear Message From Chair Warsh
With so much talk about what the Fed Chairman, Kevin Warsh, is saying he won’t say in the way of offering guidance, I decided to organize what he did say. I think it offers quite a bit of guidance into what he thinks is important, and why. Friday’s markets reacted quite decisively.
Below you’ll find Chair Warsh’s direct quotes organize into two categories:
- Important economic data and how Warsh views them
- Warsh’s statements about the current stance of monetary policy
Each category is organized into themes.
Once you form an opinion on what he said, next you can ask how did the market adjust as a result?
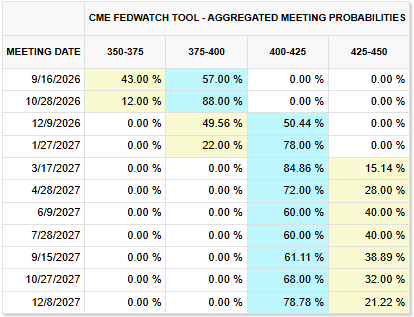
An easy and important adjustment to see was that Fed Funds futures market increased its expectations of rate hikes coming in the near future. One interpretation of the data below is that the market sees an 88% chance there will be hike by October, and a 78% chance there will be a second one by January.
It’s debatable what a few rate hikes will do to inflation and the bull market, but on Friday the stock indexes, bonds, gold and several sectors reacted with very clear moves.
Here’s the chairman said:
1. Important economic data and how Warsh views them
How data should be evaluated
- “Nor should we rely on isolated data points. Trends matter most.”
- The data should be “as relevant, contemporaneous, accurate, and actionable as possible.”
- The Fed should evaluate whether aggregate demand is “broadly consistent with aggregate supply,” although the supply side can only be inferred and the assessment is “imprecise.”
Financial-market indicators
Warsh says the Fed needs “clear market signals, as unfiltered as possible,” specifically:
- “Market internals.”
- “The level and change in asset prices across sectors.”
- “The prices and trading volumes of Treasury securities.”
- “The foreign exchange value of the dollar.”
- “The cost and availability of credit.”
- “The price of a broad set of commodities.”
His stated purpose:
- These indicators should reveal “the state of broader financial conditions” and “the risks and uncertainties in the financial cycle.”
Business investment and corporate activity
- Business capital expenditures are “rising rapidly.”
- Investment in equipment and intangibles increased approximately 9% over four quarters, “its highest growth rate since 2021.”
- More than half of the year’s capital-expenditure growth was likely attributable to AI-related investment.
- S&P 500 profits grew by more than 20% over the preceding year.
- Profit margins are “quite elevated, relative to history.”
- Equity-market volatility is low.
- Expectations for capital-expenditure and corporate-earnings growth are “running quite high.”
- He will watch “the change in their growth rates, the second derivative.”
- He also identifies the resulting effects on “asset prices, business confidence, consumer income, and spending” as “equally important to gauge.”
Credit conditions
- Corporate-bond and leveraged-loan spreads are “near the low ends of their historical ranges.”
- Issuance volumes have been “quite strong.”
- Commercial and industrial lending standards are “on the easier end of their historical range.”
- “Credit and loan markets are showing few signs of policy restraint.”
- Housing and agriculture are showing strains.
- Nevertheless, “on balance, I would be hard pressed to describe broad financial conditions as restrictive.”
Consumer demand and domestic activity
- Real consumer spending has been “healthy,” rising more than 2% over four quarters.
- Private domestic final purchases increased at a pace of nearly 3% during the calendar year.
- He says private domestic final purchases “typically carries more signal than gross domestic product.”
- His assessment of that trend: “positive.”
- His overall assessment: the economy “appears to have strengthened.”
- Main Street and Wall Street have been “remarkably resilient.”
Labor-market data
- Labor markets are “quite stable.”
- The unemployment rate is 4.1%, which is “low by historical standards.”
- The unemployment rate has “not changed much for a couple of years.”
- Four-week-average unemployment claims are “near their lowest level in decades.”
- Labor supply is “barely growing,” so “monthly job gains are naturally going to run low.”
- Recent graduates are identified as an area of concern.
- In general, people wanting employment are “holding or finding jobs.”
- His conclusion: “I believe the labor markets are consistent with full employment.”
Inflation data
- Twelve-month PCE inflation: 3.7%.
- Six-month PCE inflation: 4.1%.
- CPI measures are “elevated.”
- Core PCE and core CPI measures are also “elevated.”
- His summary: “Inflation is running above our 2 percent target.”
- Broad inflation measures have fallen significantly from their 2022 highs, but “progress over the past two years has been modest.”
- The summer PCE and CPI readings were better than expected, but “they do not tell me that underlying trends have meaningfully improved.”
Underlying inflation measures
Warsh says policymakers should determine whether underlying inflation is:
- “Rising, falling, or stuck in place.”
- Moving in the right direction at an adequate “speed.”
He specifically identifies:
- The 199 individual components of the PCE price index.
- Over 12 months, 54% of the PCE basket recorded increases above 3%.
- Over six months, 49% recorded annualized increases above 3%.
- Both readings are below their post-pandemic highs but remain “quite elevated.”
- Overall commodity prices have recently risen and “bear watching.”
- The relevant question is whether commodity trends indicate “upside inflation risks.”
Wage growth
- Wage growth is “moderate.”
- But Warsh says it “has not proven a reliable indicator of future inflation for a very long time.”
Inflation expectations
- Medium-term inflation expectations “by and large, look stable.”
- Inflation-compensation measures from the swaps market send “a strong and similar message.”
- Expectations are “well anchored.”
- However, they “must be closely minded.”
- The Fed must ensure that inflation expectations “do not get unanchored.”
Money and monetary aggregates
- “Money matters.”
- The Fed should monitor money created by the central bank and money created through banking and financial systems.
- Financial innovation may change the relationship between the monetary base, money velocity, and the economy, but that is not a reason to ignore money’s effects on “financial conditions and prices.”
2. Warsh’s statements about the current stance of monetary policy
His clearest description of current restraint
- “Credit and loan markets are showing few signs of policy restraint.”
- “On balance, I would be hard pressed to describe broad financial conditions as restrictive.”
The previous policy decision
Regarding the July meeting:
- The FOMC viewed labor markets as stable and output as solid, while inflation “remained too high.”
- Warsh and a majority of the committee believed “the wiser course was to await new information in the intermeeting period.”
- The potential developments identified were supply chains, investment flows, and geopolitics.
- They were waiting before deciding “whether a change in interest rate policy was advisable.”
- They expressed “joint readiness to act as circumstances might require.”
Present policy priority
- “The Fed’s predominant focus right now should be on prices.”
- The 2% PCE inflation objective is “a firm, fixed target.”
- “Price stability is not self-executing, nor is inflation necessarily mean-reverting.”
- “It is the Fed’s job to deliver stable prices.”
His decision standard
- “We must be confident that underlying inflation is moving to our objective, clearly and at sufficient speed.”
- “Otherwise, we have work to do.”
Policy instruments
- “Short-term interest rates are the predominant tool to achieve the dual mandate.”
- Unconventional stimulus may be appropriate during genuine crises but otherwise “should be used sparingly, if at all.”
His close
- “I stand here today committed to a discipline, not to a decision.”
The Market Reaction
As with many Fed events, the market reaction is a head fake, and this was the case on Friday.
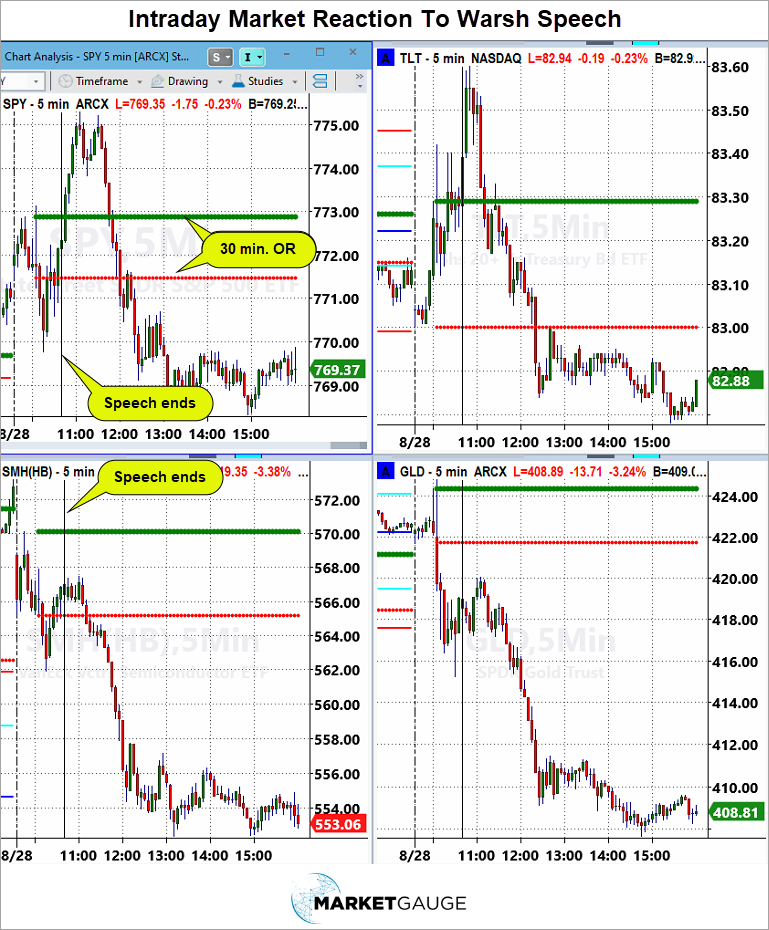
During and immediately after the speech the SPY (stock indexes) and TLT, (long bond ETF) rallied confidently.
Interestingly, the only sector ETFs that showed strength while the market rallied were XLF and XLC. Important sectors like the SMH went flat.
The easiest explanation for what was behind the enthusiasm in the index when the majority of the market was not happy could be seen by the rally in the MAGS, the Magnificent 7 ETF.
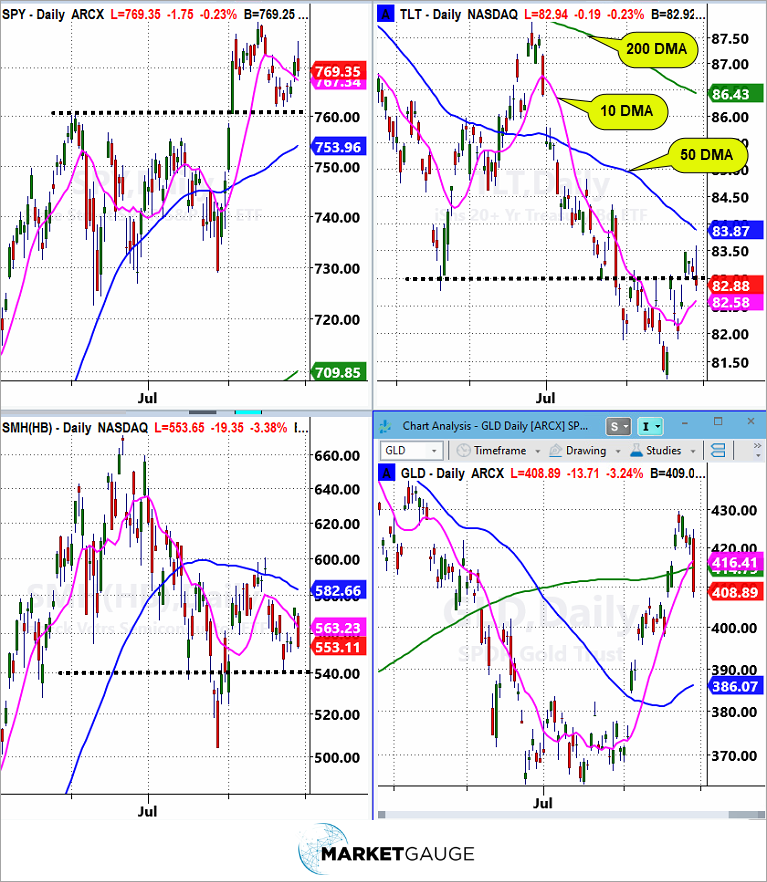
However, the rally in the bonds faded quickly and then everything else followed as illustrated by the charts below.
One Day Doesn’t Make A Trend, But...
One day does not make a trend, but unfortunately the trends are already in place, so this market reaction reinforced the bearish pressure that’s building with the idea that rate hikes are coming.
The daily charts below tell a clears story.
Gold believes that Warsh is going to focus on inflation and that means higher rates. It could be argued that higher short-term rates with a focus on inflation could be bullish for long-term bonds (TLT), but that’s not what the market was saying on Friday. Finally, the belief in higher rates puts pressure on an already weak SMH.
NVDA’s positive earnings announcement began a rally in SPY out of its corrective trend, but Friday demonstrated that the bulls aren’t as strong as the looked the day before.
I look at Fed announcements as having 3 time frames of information. The first 30 minutes in which the market reacts to the news, the range of the whole day, and then the reacting to that range in the days that follow.
Maybe Friday was just a skittish market, and stocks will brush it off. However, if the bearish actions carries into next week, the SMH and TLT are both dangerously weak, and that’s trouble for the SPY.
Keep your eyes on the levels marked with the dotted lines.
If you'd like access to the MarketGauge indicators, strategies, automated trading models, and more, contact us.
Have a great week!
Geoff Bysshe
Co-Founder
MarketGauge.com
 |
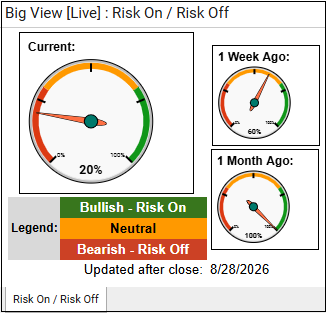 Every week we review the big picture of the market's technical condition as seen through the lens of our Big View data charts. Every week we review the big picture of the market's technical condition as seen through the lens of our Big View data charts.
The bullets provide a quick summary organized by conditions we see as being risk-on, risk-off, or neutral.
The video analysis dives deeper. |
Summary: The major indexes remain broadly constructive, supported by low volatility, strong growth stocks, and positive longer-term trends, but weakening breadth, momentum, volume, and risk gauges suggest the rally is becoming increasingly narrow beneath the surface. With small caps struggling, market internals deteriorating, and historically weak September seasonality approaching, the backdrop remains cautiously risk-on but warrants greater selectivity and attention to downside risk.
Risk On
- Markets were mixed with the SPY, QQQ, DIA all up about half a percent, while IWM closed down -1.4%, mostly from a sharp move lower on Friday. QQQ regained its bull phase this week. Real Motion momentum is waning, particularly in small caps. (+)
- Volatility confirming price action, trading at its lowest levels since December 2025. (+)
- Value and Growth remain in bull phases with growth showing a little more short-term momentum than value. (+)
- Foreign equities held up this week with both in bull phases and EFA being right off its all-time highs. (=)
- Bitcoin held its recent highs, above its 200 and 50-Day Moving Averages. (+)
Neutral
- The modern family is starting to show some cracks, with 5 of the six members losing their bull phases. Biotech is holding onto a strong lead over its 50-Day Moving Average. (=)
- Volume patterns weakened to a neutral with slightly more distribution days vs accumulation days over the last several weeks in 3 of the 4 key indexes. (=)
- The majority of sectors were down, led by healthcare and energy. Technology and Financials were up. Overall a weak neutral score. (=)
- The 52-Week new high new low ratio moving averages continue to trend lower, though we did see a noticeable reversal in the ratio reading. (=)
- The color charts (moving average of stocks above key moving averages) are showing weakness on the 20 and 50-periods, particularly in SPY & IWM. The longer-term 200-Day trends are still positive across the board. (=)
- Gold closed back below its 200-Day Moving average, taking a breather after a large move in August.. (=)
- Bonds have recovered from their lowest levels hit two weeks ago. They haven’t recovered their 50-Day Moving Average and remain in a downtrend with negative momentum. (=)
Risk Off
- Soft commodities had a strong week, breaking out above recent price action to new recent highs. DBA is overbought on Real Motion. (-)
- Market internals weakened across the board with the up down volume ratio, McClellan Oscillator and Cumulative Advance Declines all falling below their mid-points, despite the market being up. (-)
- Risk gauges weakened to 20%, with only the SPY-XLU ratio positive, though underneath the hood, the ratios are only marginally weak and look like they could flip back fast. (-)
- Seasonal trends historically point to a weak September. (-)
Actionable Trading Plan
Maintain a moderately bullish but increasingly selective posture, as the major indexes remain in constructive longer-term trends and volatility is extremely low, but weakening breadth, momentum, and market internals argue against aggressively adding exposure. Favor large-cap growth and technology, which continue to show relative strength, while keeping exposure lighter in small caps, healthcare, and energy until momentum and participation improve.
Use the current environment to hold strong positions and buy selectively on controlled pullbacks rather than chase strength. Tighten stops or raise trailing stops on extended winners, particularly as September approaches, and consider taking partial profits where positions have become overbought. Keep some cash available to deploy if breadth, volume, the Modern Family, and risk gauges begin confirming the strength in the major indexes.
Watch SPY and QQQ trend support closely, along with the 20- and 50-day breadth readings. A recovery in market internals, improving accumulation, and risk gauges moving back toward risk-on would support increasing exposure; continued deterioration—especially if SPY/QQQ begin losing key moving averages—would warrant raising cash, reducing weaker positions, and shifting toward capital preservation. With volatility near multi-month lows and historically weak September seasonality ahead, maintain disciplined stops and avoid becoming complacent simply because headline indexes remain near their highs.
**There will be no video this week
Stay One Step Ahead of The Markets and Profit
From The Current Volatility With Market Outlook